| View in browser |
If you have followed along with our monthly market updates, you've heard us mention the strength of the market since this time last year. This month we'll dig a little deeper into the why - The TLDR is both San Mateo and Santa Clara Counties have experienced an astonishing rise in the median home price over the last year. The spring market is historically the strongest of the year - and that trend seems to be repeating. However, we'll look at certain factors like the average age of homebuyers and the trends of institutional investors to understand the constraints on inventory that have contributed to our rising prices. We'll also evaluate some of the migration data to see if the Bay Area is over as some have predicted (hint, IT'S DEFINITELY NOT!). Finally, more clients have been reaching out to hear about other markets to invest in as a hedge against inflation concerns. If you're interested in hearing our take on other markets in California or elsewhere, please reach out to us as we have a strong network to help you evaluate what opportunity might be right for you. |
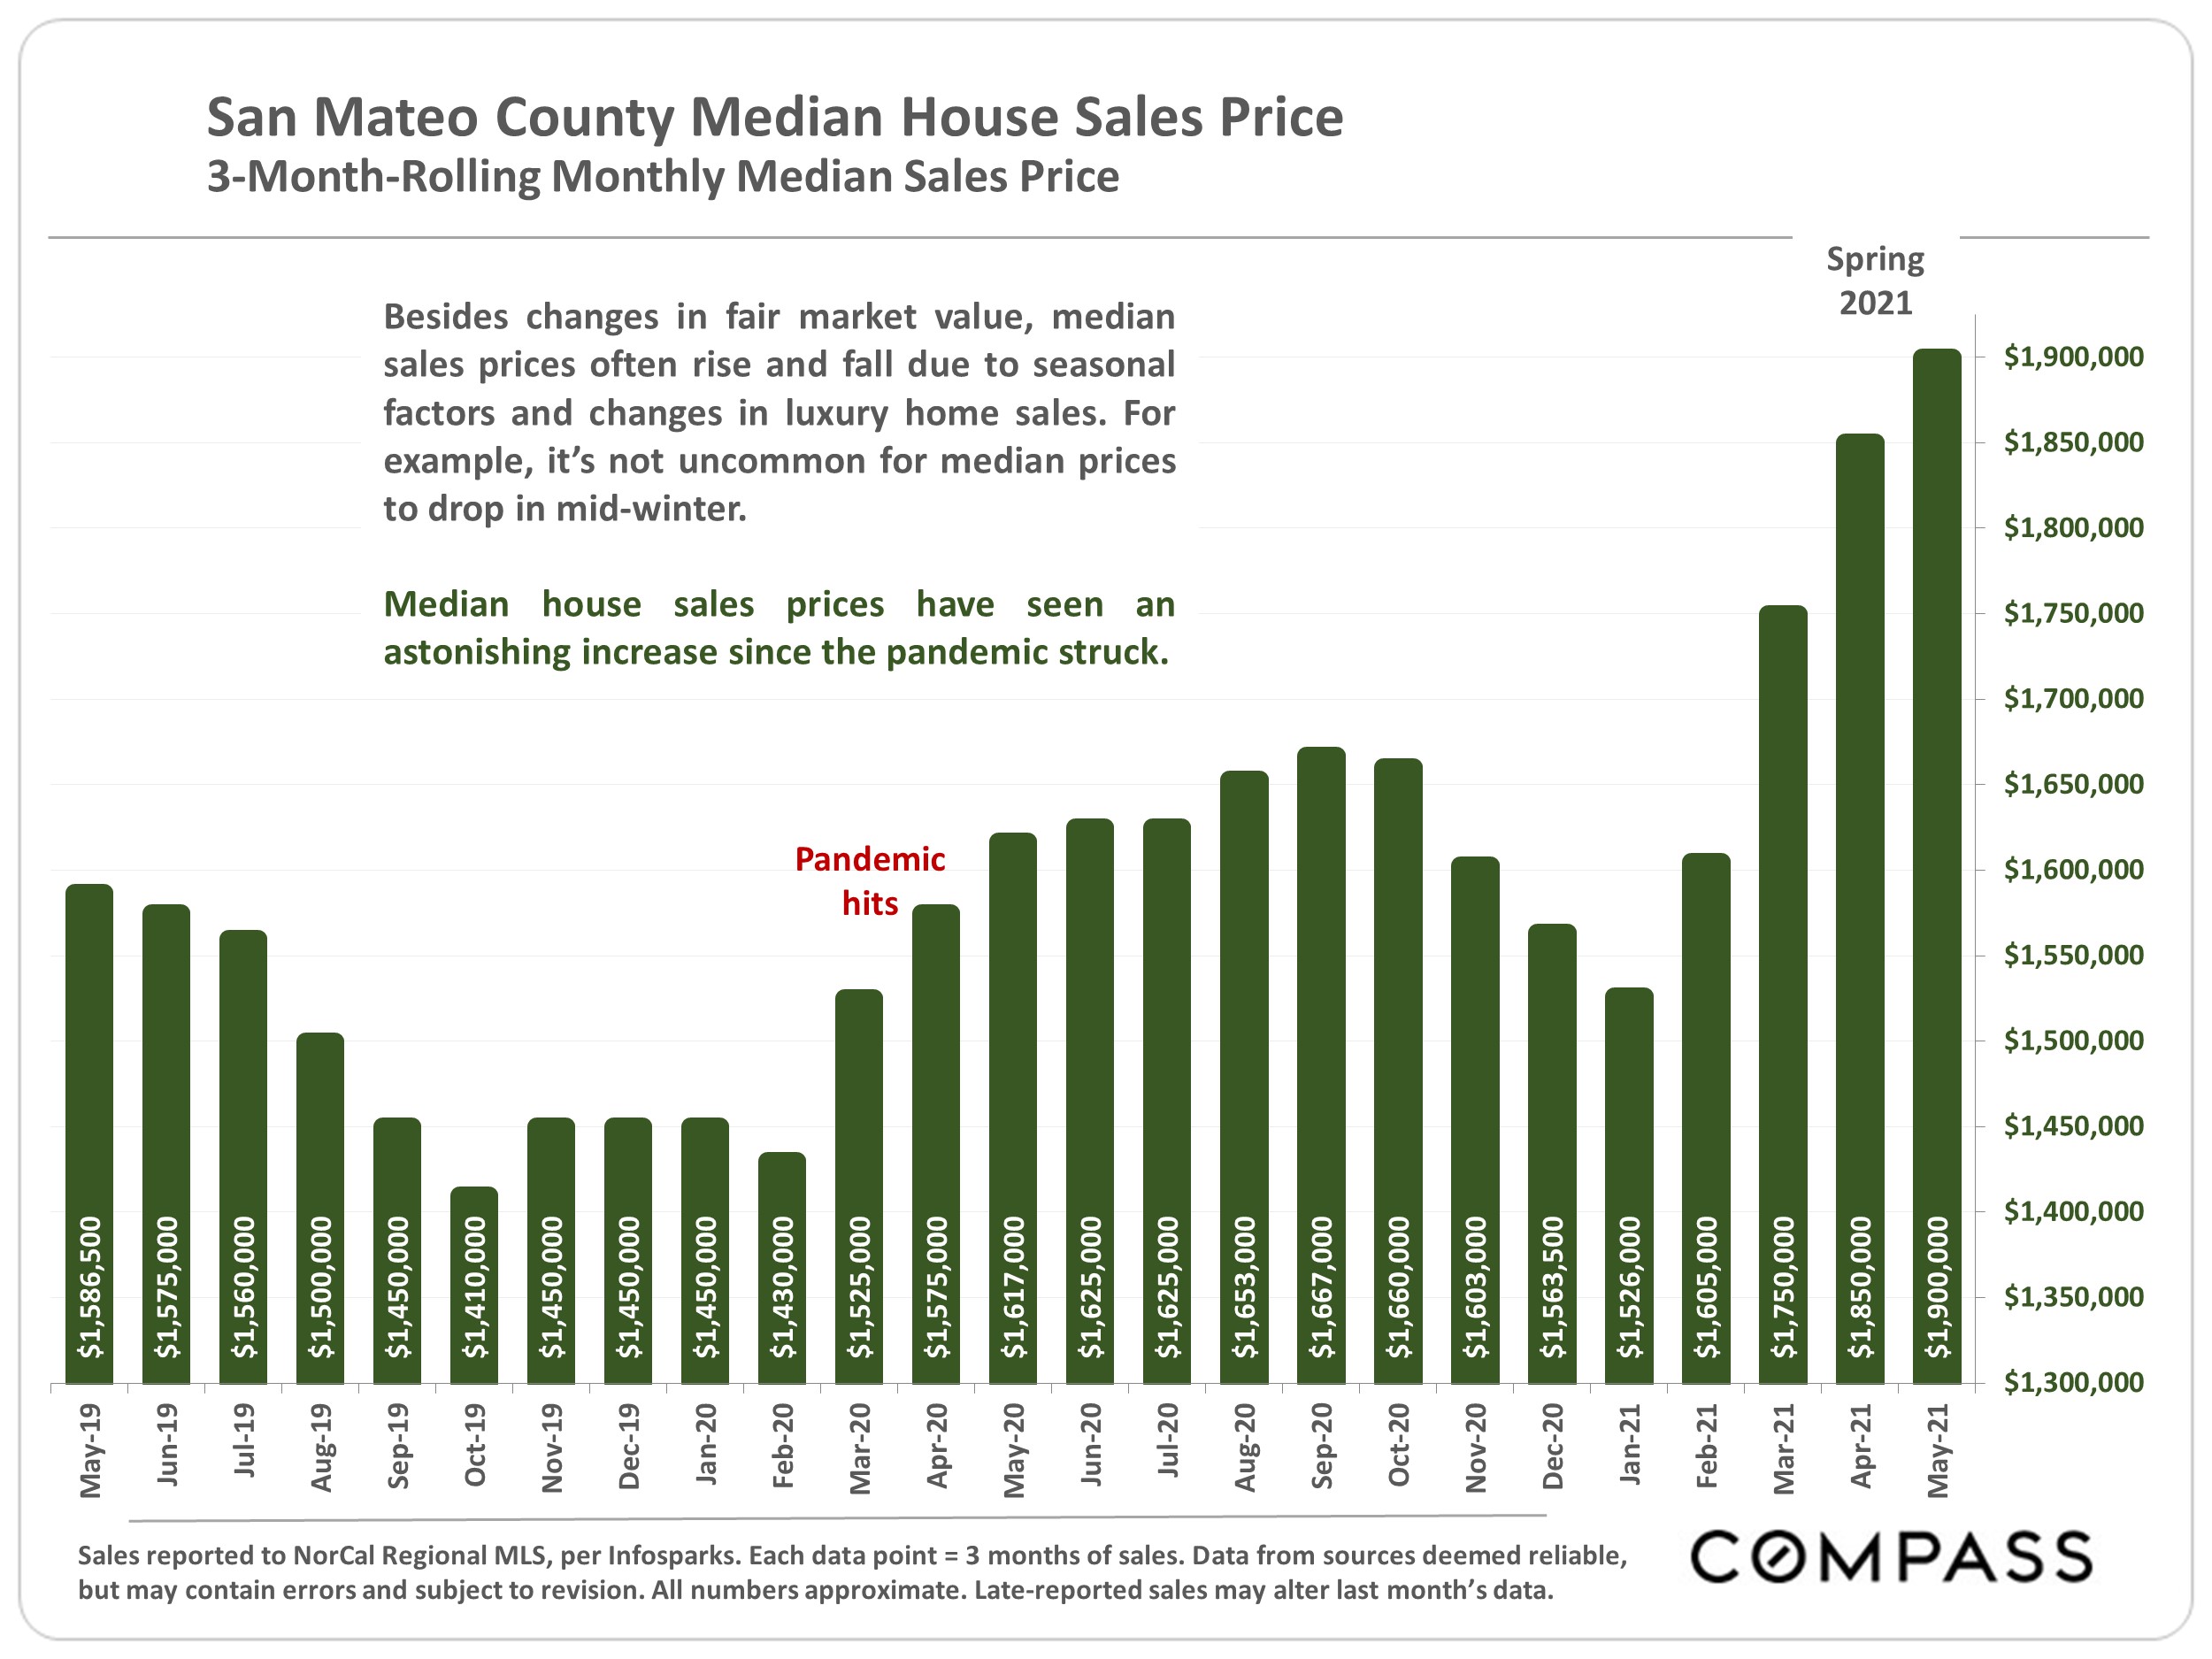
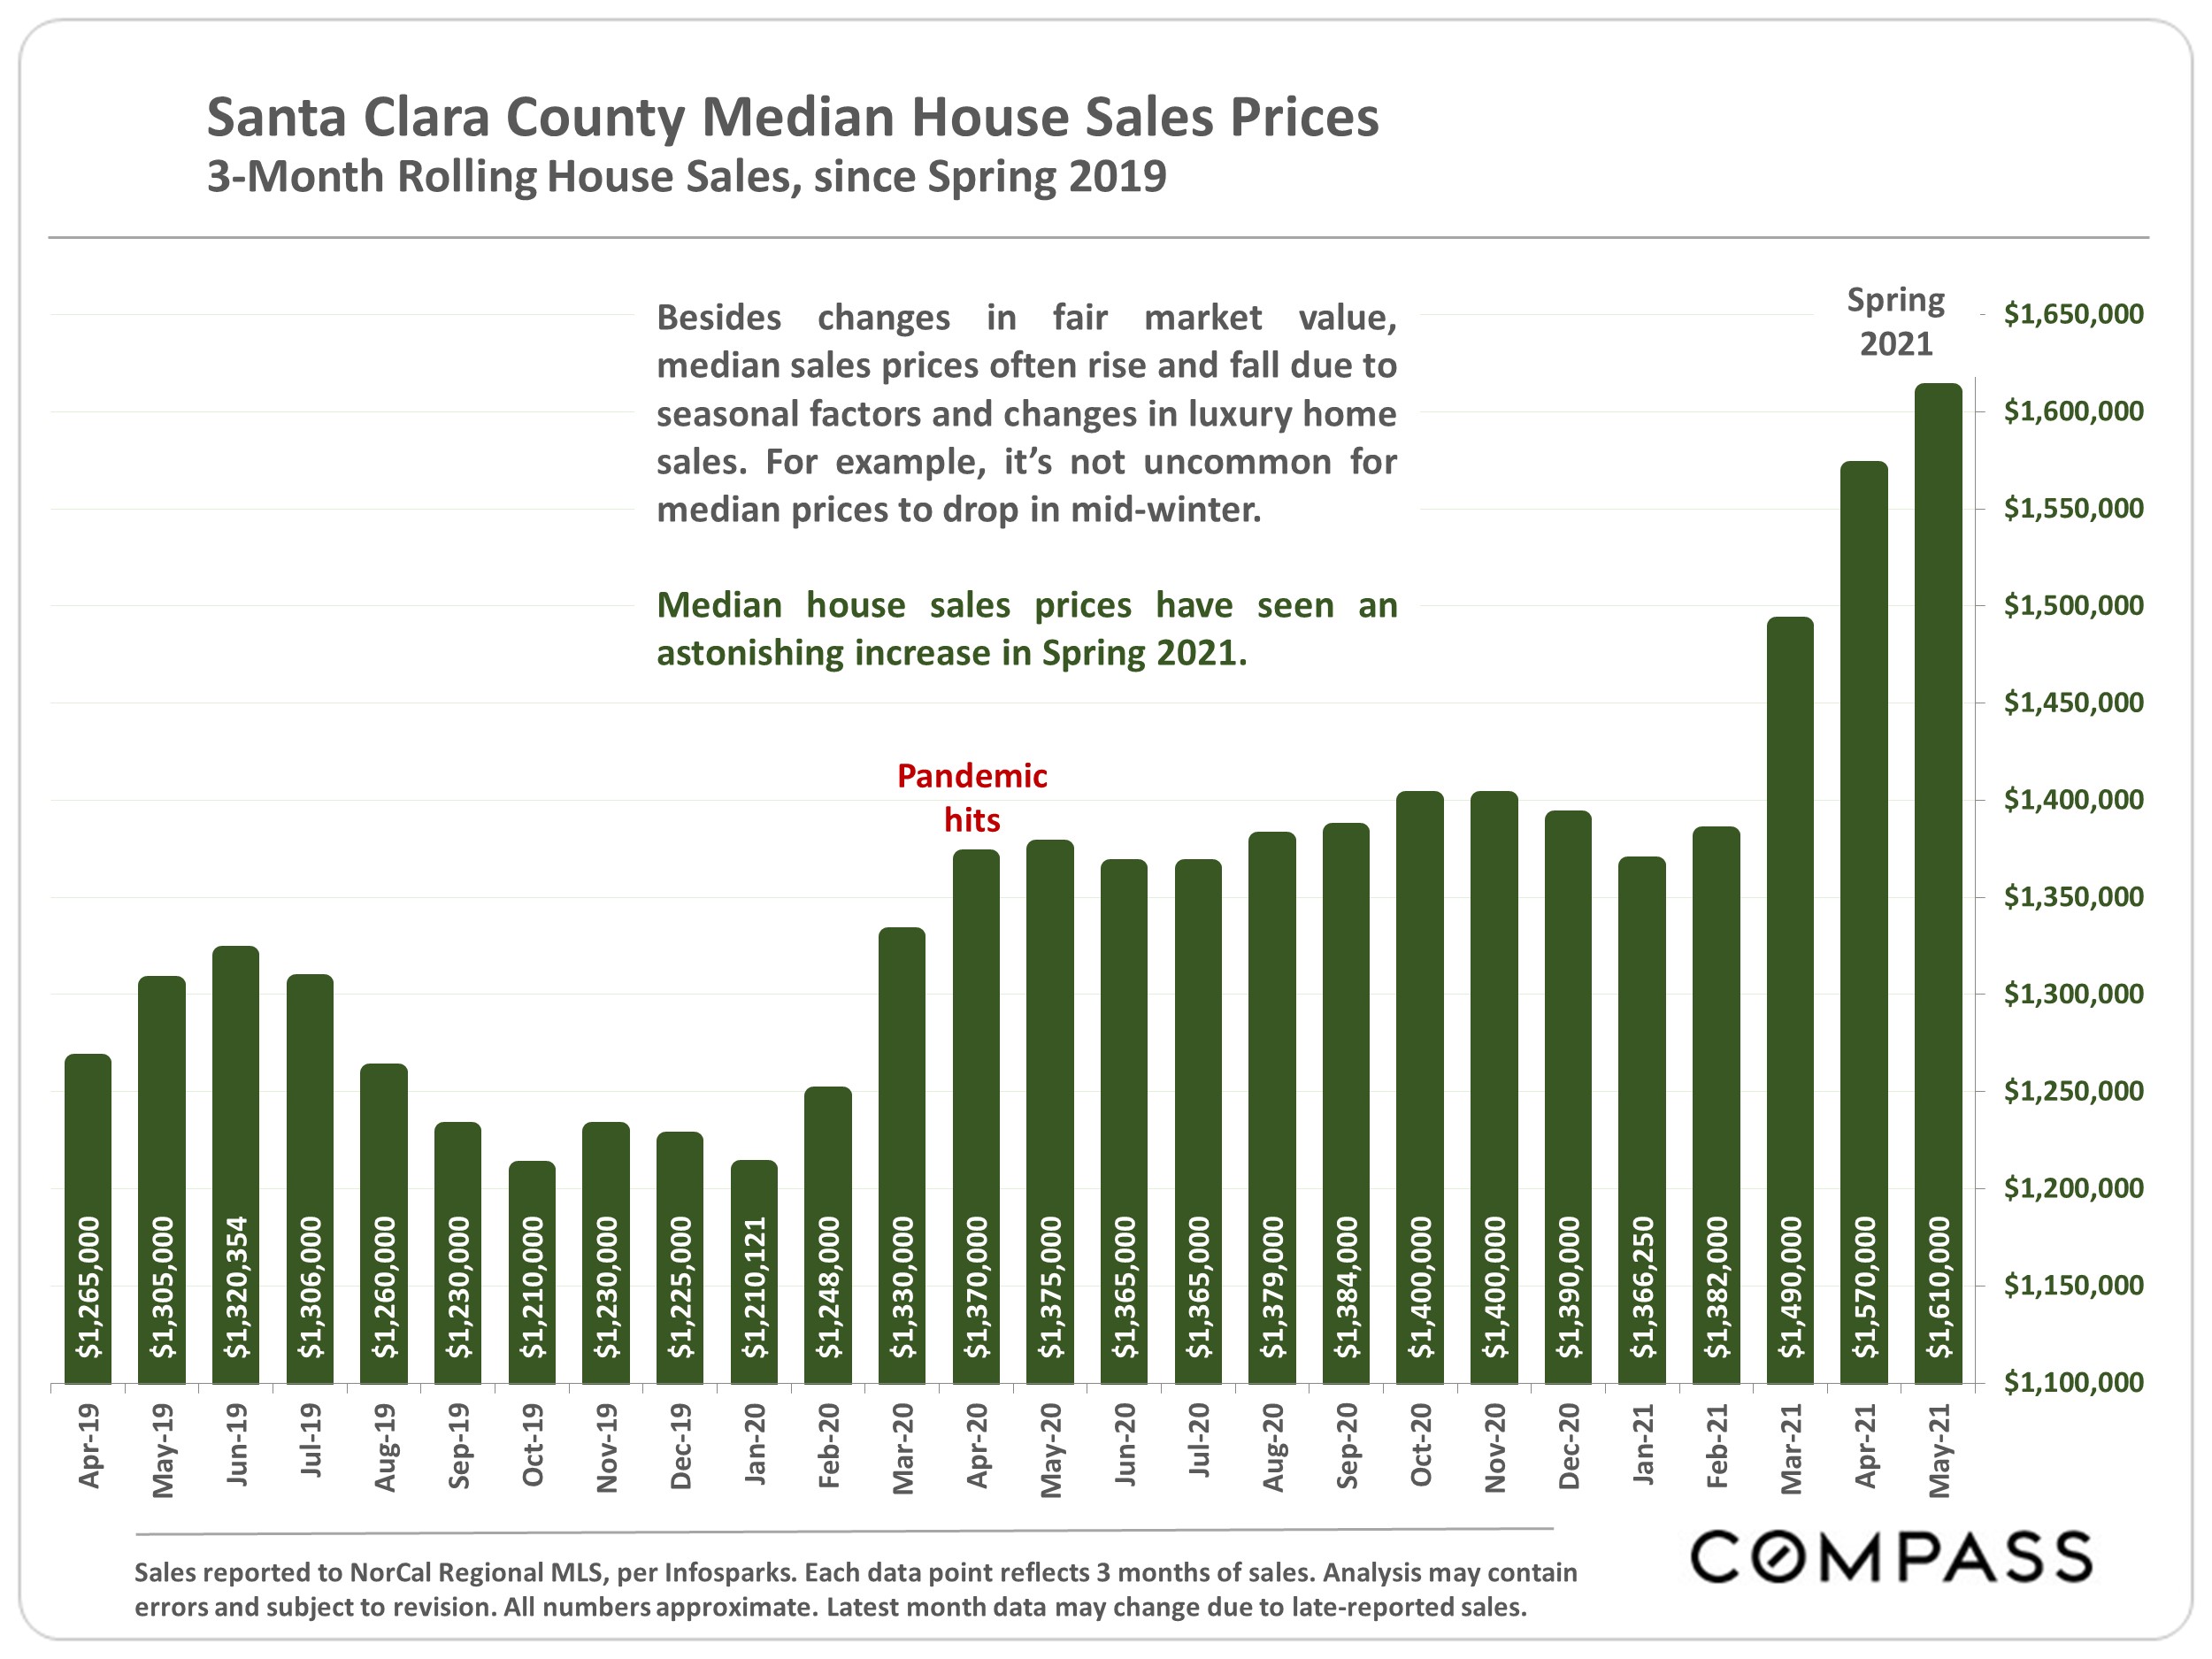
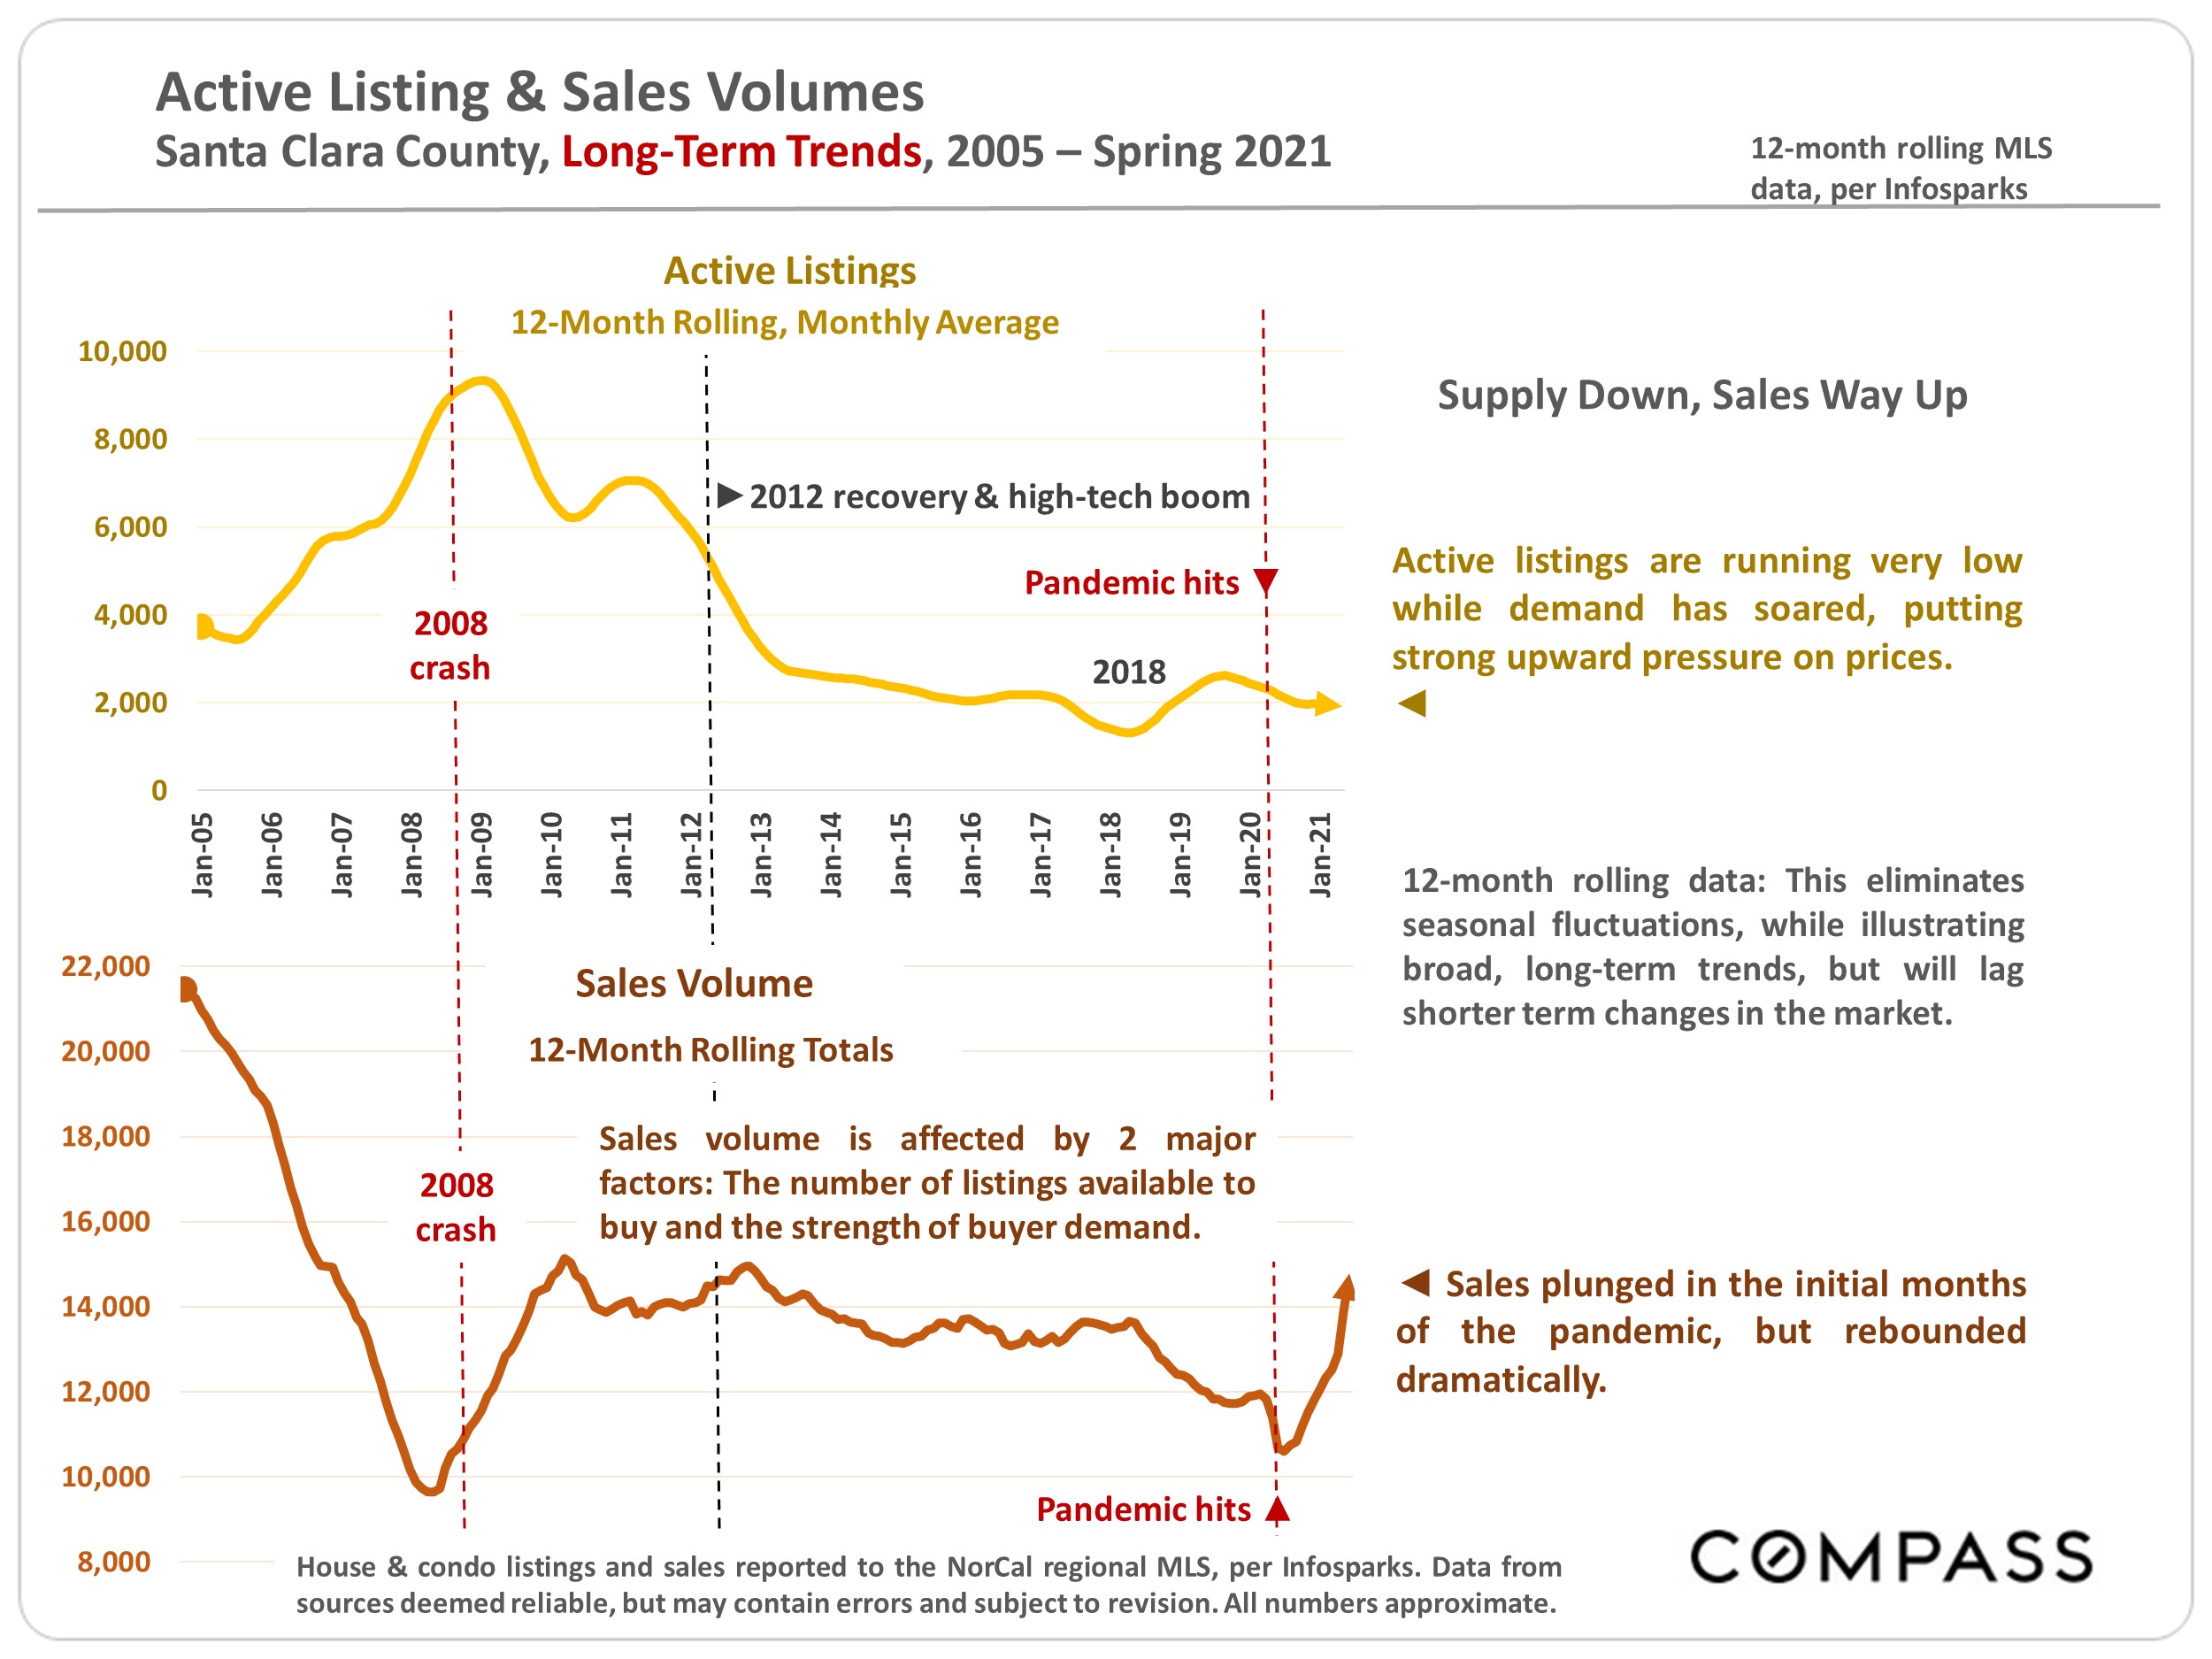
In San Mateo County the median home price in April 2021 was just over $1,900,000 (the highest in the greater Bay Area), and in Santa Clara the median home price was just over $1,600,000 - a 19% and 16% change in year over year prices. |
Factors Affecting Inventory |
We've shared some of the contributing factors for the increased buyer demand over the last year - some buyers wanted more space as a result of the pandemic (this is particularly true in the luxury/>$3m market) and some wanted to take advantage of the historically low interest rates. Here we'll look at the other side of the equation - what are the factors affecting supply in our market? |
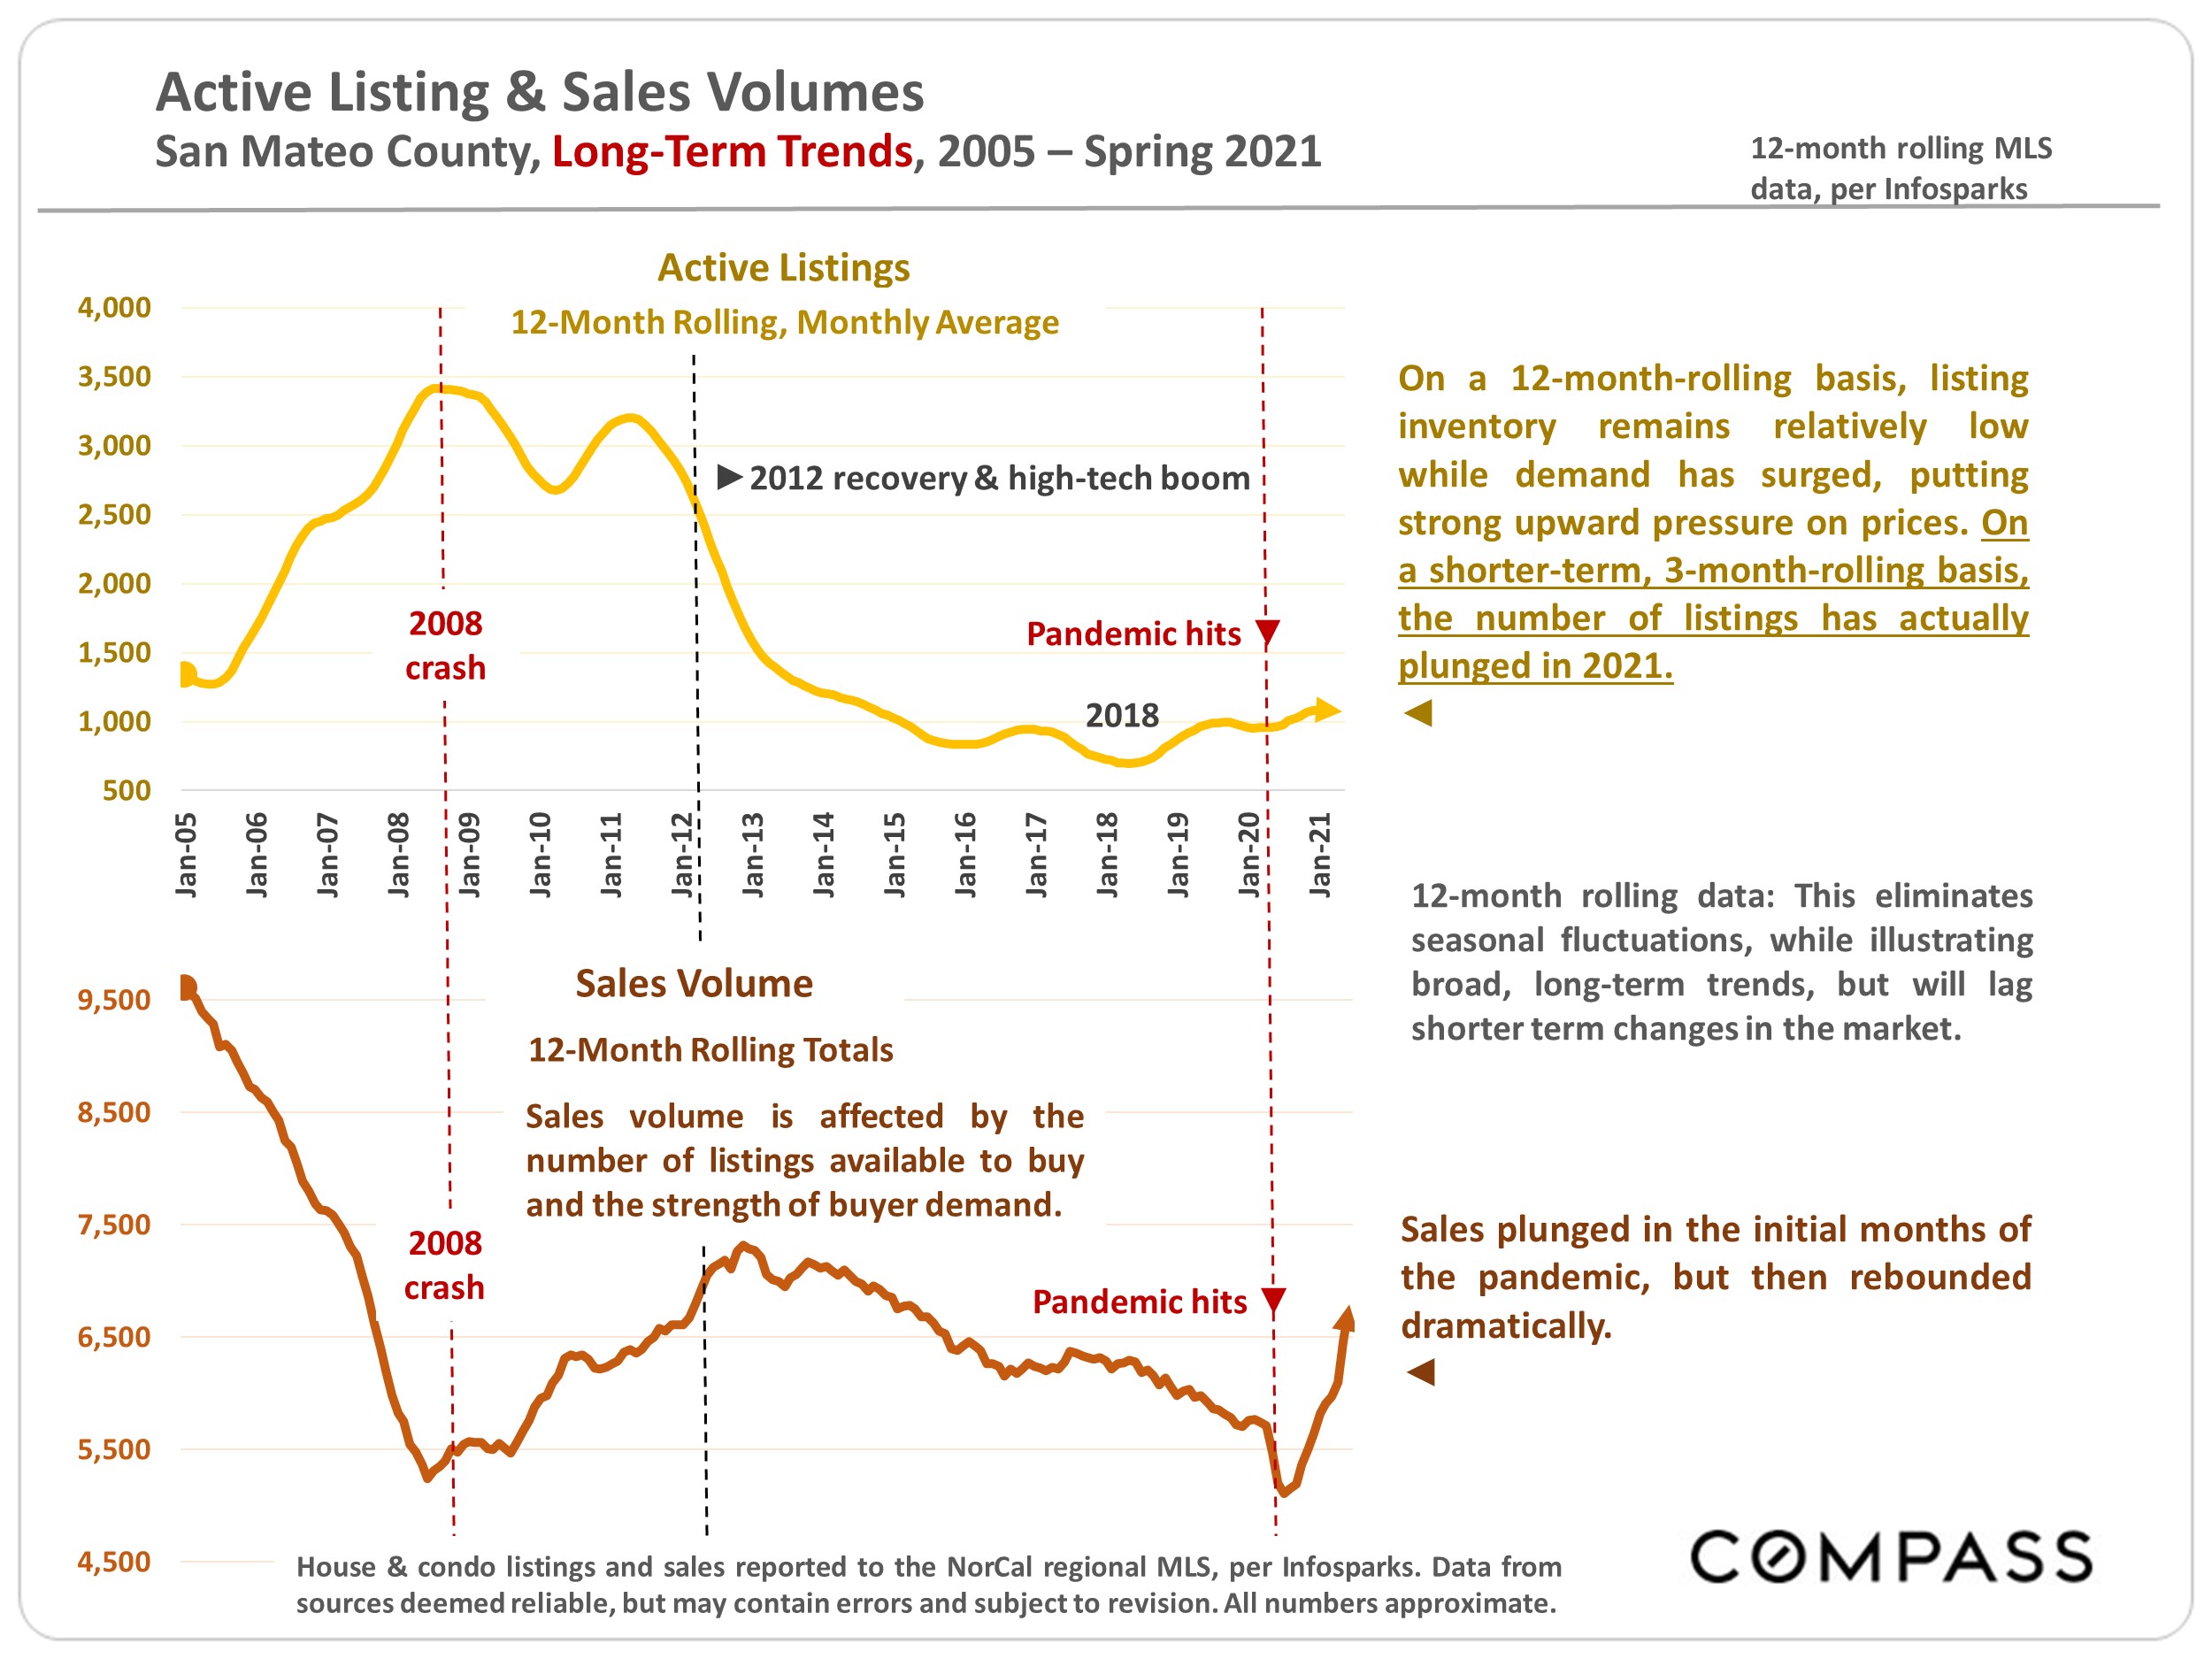
Buyer demand - as there are more motivated buyers than homes available, the homes on the market tend to sell quickly. Changing demographics - As home prices have gone up, people's ability to buy has been delayed. As a result the median age of homebuyers has gone up almost 20% in the last decade, from age 39 in 2010 to 47 in 2020. And it turns out the older you are, the less likely you are to move - in 2010 homeowners owned for 5 years, versus 8 years in 2020. These two factors have significantly constrained our inventory during the recovery from the last recession. More investors going residential - from individuals seeking an additional income source, to large institutional investors seeking to get into the rental market - almost 20% of home sales are by investors (per John Burns Consulting) Investors tend to buy and hold, so there's been much less turnover. Downsizing homeowners are turning to AirbnbAirBnb - Due to factors like a low tax basis (Thanks Prop 13!) homeowners that wish to downsize or move to a more affordable area are converting their primary residence to a rental property (either long term or short term i.e Airbnb or VRBO). New construction has declined - the number of new construction permits has declined in the Bay Area over the last ten years. On the peninsula in particular, there's very little raw land remaining to build new homes on. New construction usually happens when an older existing home is scraped and a new home replaced. Builders can't operate at scale the way they can in other markets.
|
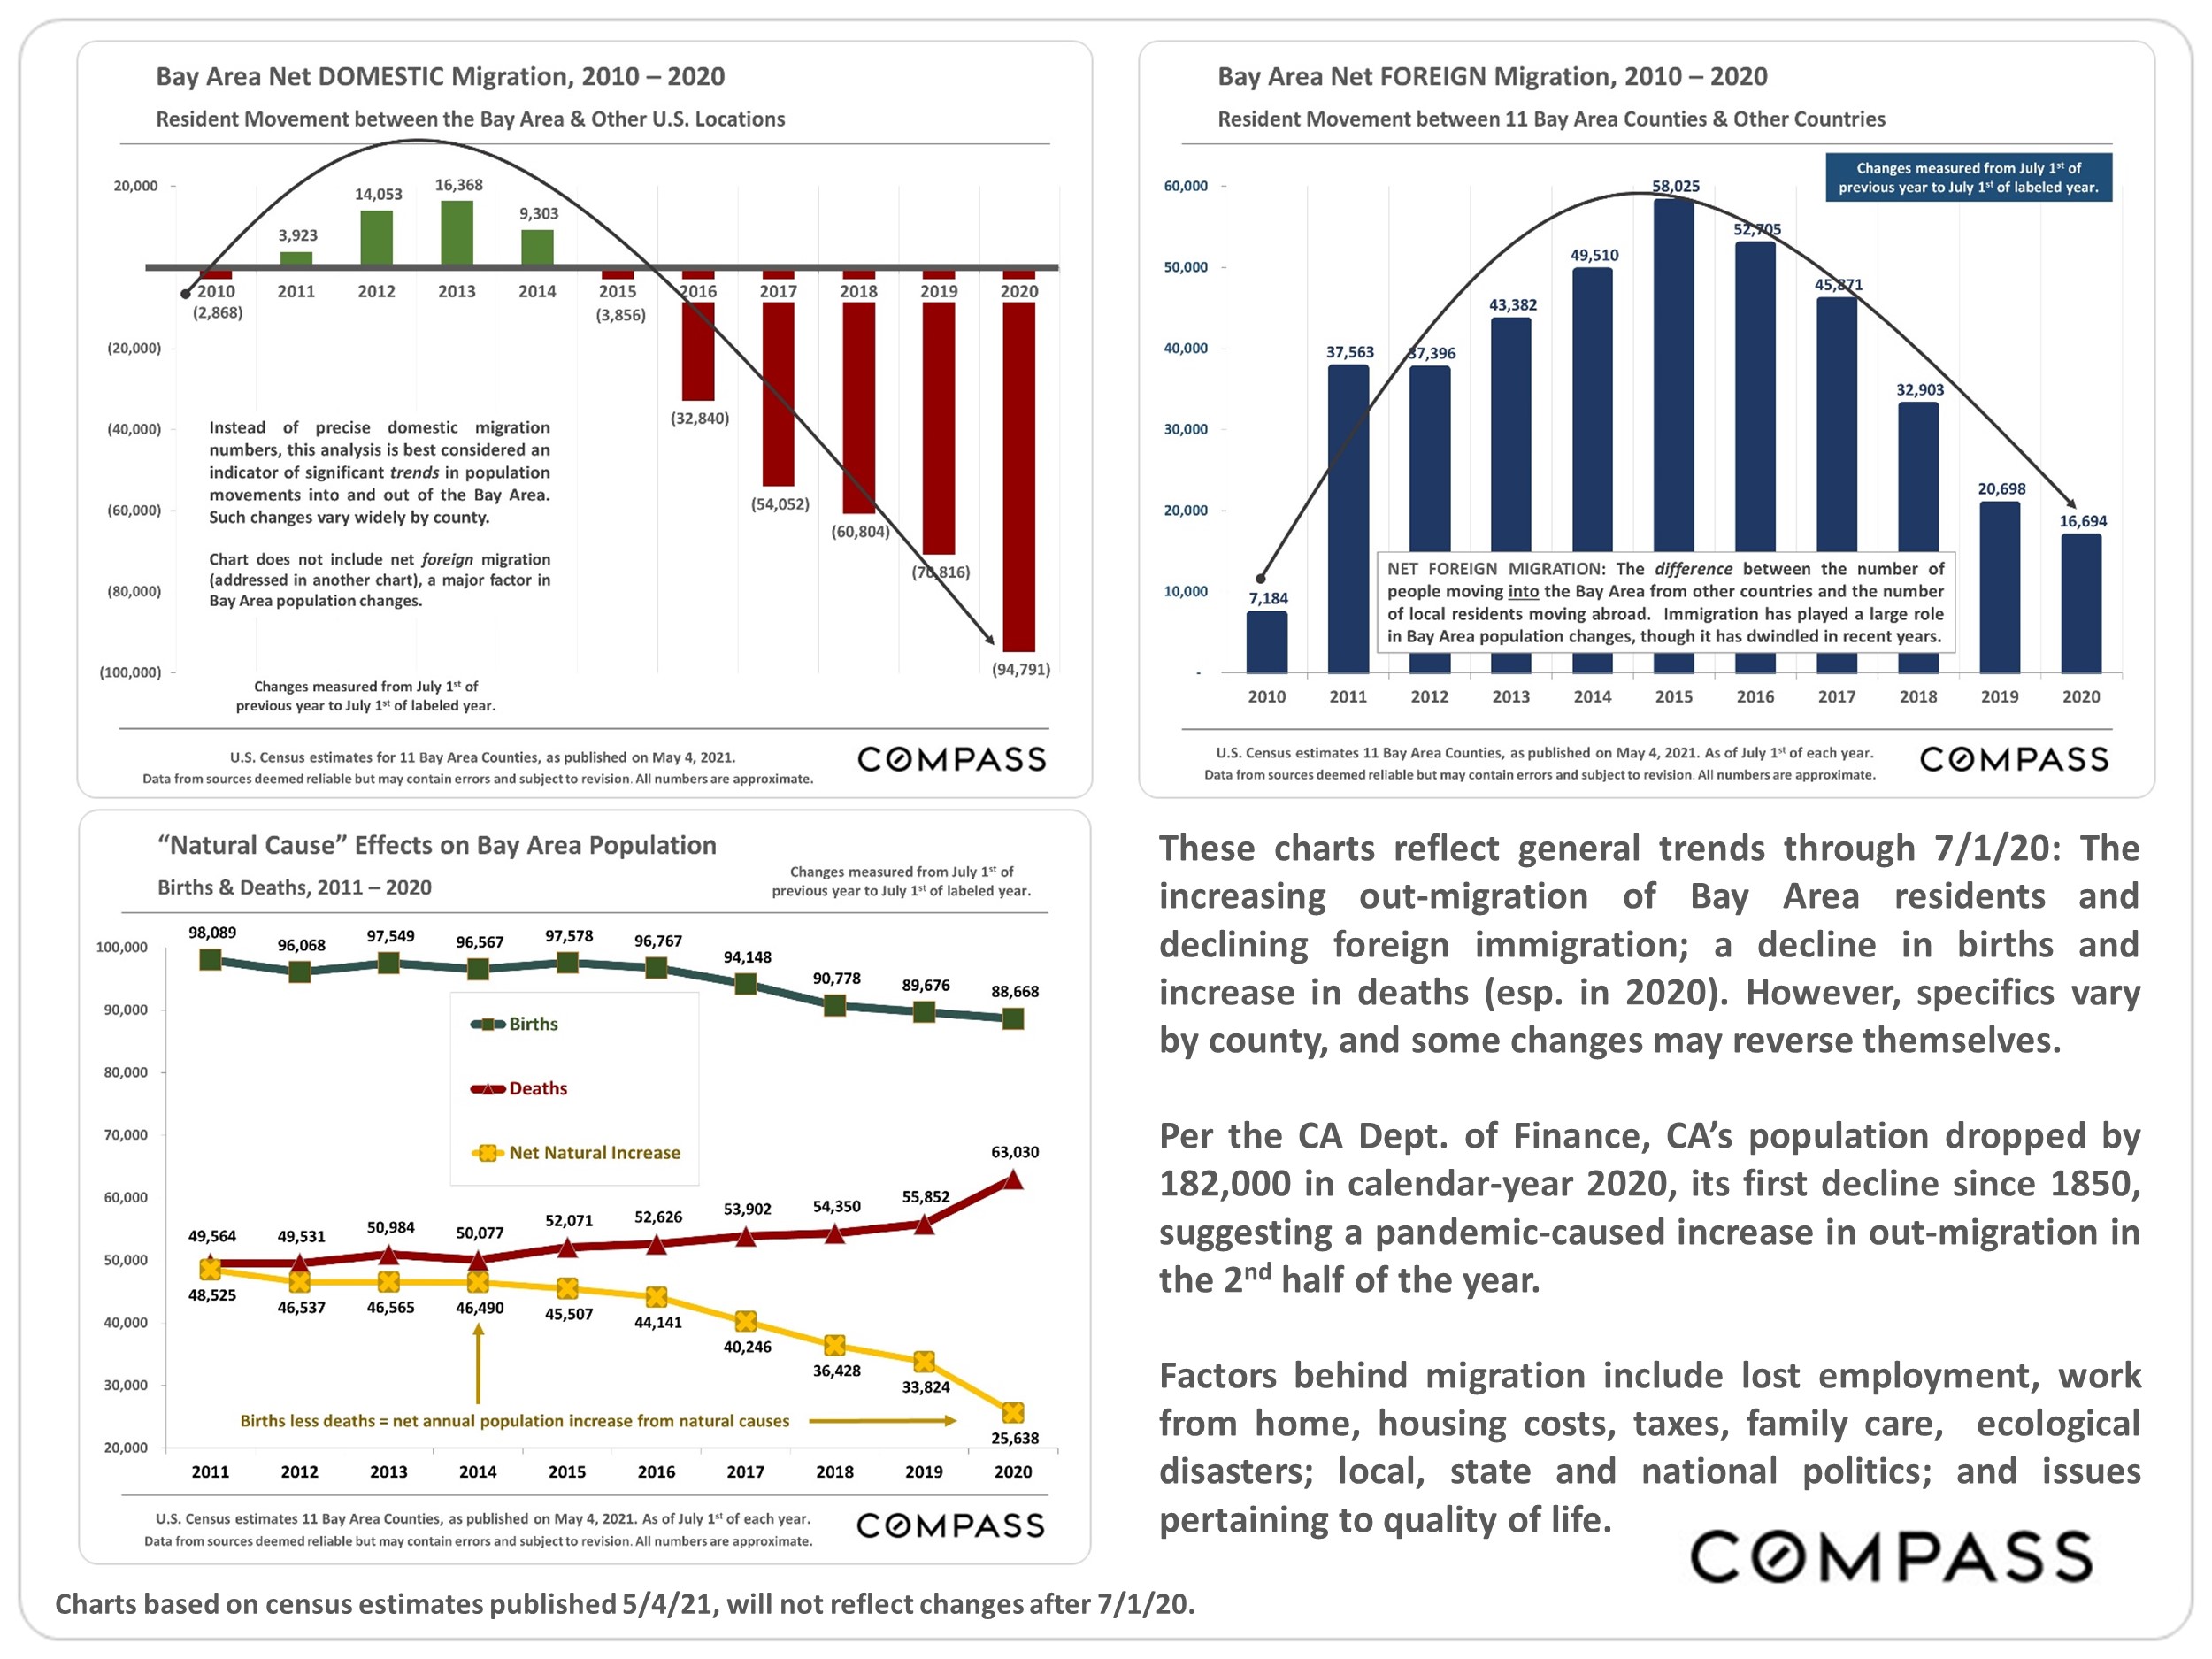
Below household numbers are estimates extrapolated from The Wall Street Journal article, “Americans Up & Moved During the Pandemic,” based on permanent, change-of-address filings in 2020. The term “household” can signify one or many persons. Calculations do not appear to include foreign immigration. The general dynamic in the Bay Area was net out-migration from more urban regions, and net in-migration into more suburban/rural areas. Of counties seeing negative changes, relocating tenants (paying very high rents) – the newly unemployed, office employees changed to work-from-home, or students at closed universities – were almost certainly the dominant component in out migration. Rents have dropped considerably, but rising home prices and the heated real estate market tell a very different story from household movement numbers. Trends may change (or reverse) with the opening of offices, universities and urban amenities. |
| Let's Get Social Follow us on Instagram to stay up to date with our team, community, and more! |
marketingcenter- |