

We sit writing with the sound of rain falling on the roof, which for early November seems out of season compared to the drier years of recent past. Similarly the housing market has slowed earlier than our typical year-end cycle.
Unlike surprise rain, the forecast of a more subdued market has been with us for several months marked primarily by the increase in mortgage rates and a cooling equities market.
Before you go searching for your rain boots and umbrellas to handle this weather, take a look at the most recent data to understand the changes and better prepare yourself for these current market conditions. We’ll leave you with a quote we heard last week that seems fitting for knowledgeable buyers in our market: “You make most of your money in a bear market, you just don’t realize it at the time.” - Shelby Cullom Davis
Thank you,
Adam, Wendy and Kat

Brief Summary
- Months Supply of Inventory (MSI)
-
Days on Market (DOM)
- Pricing
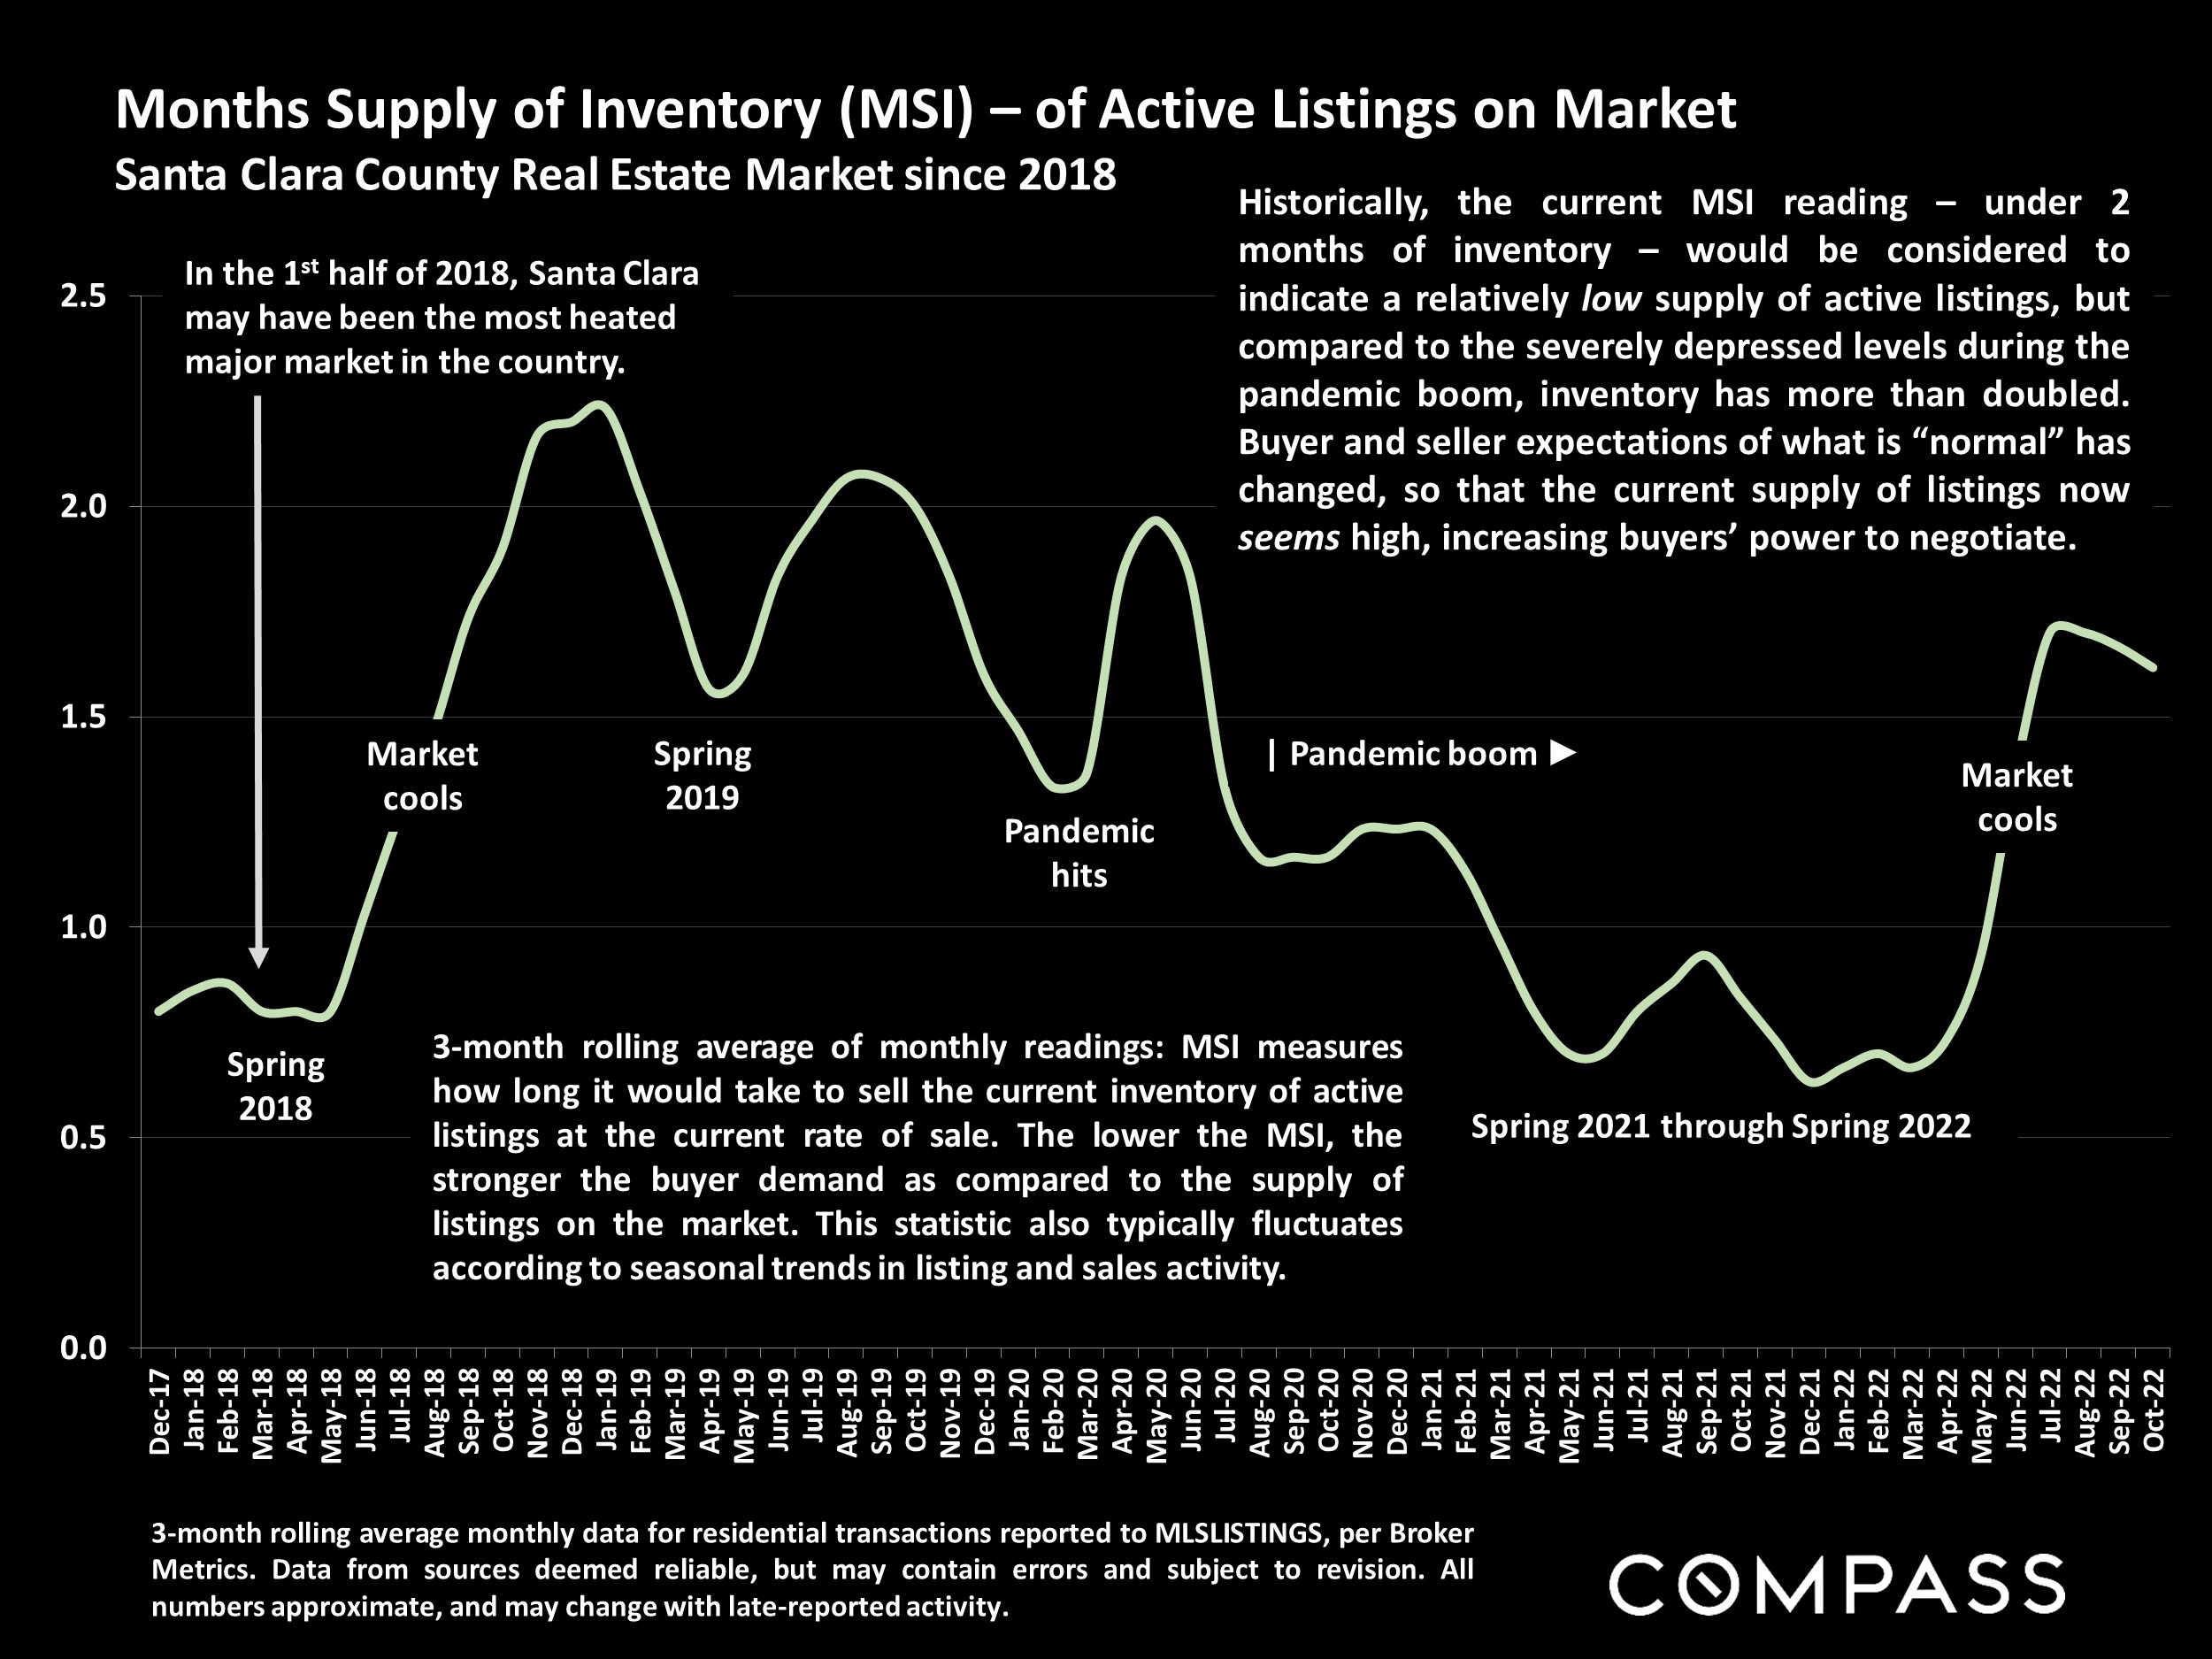
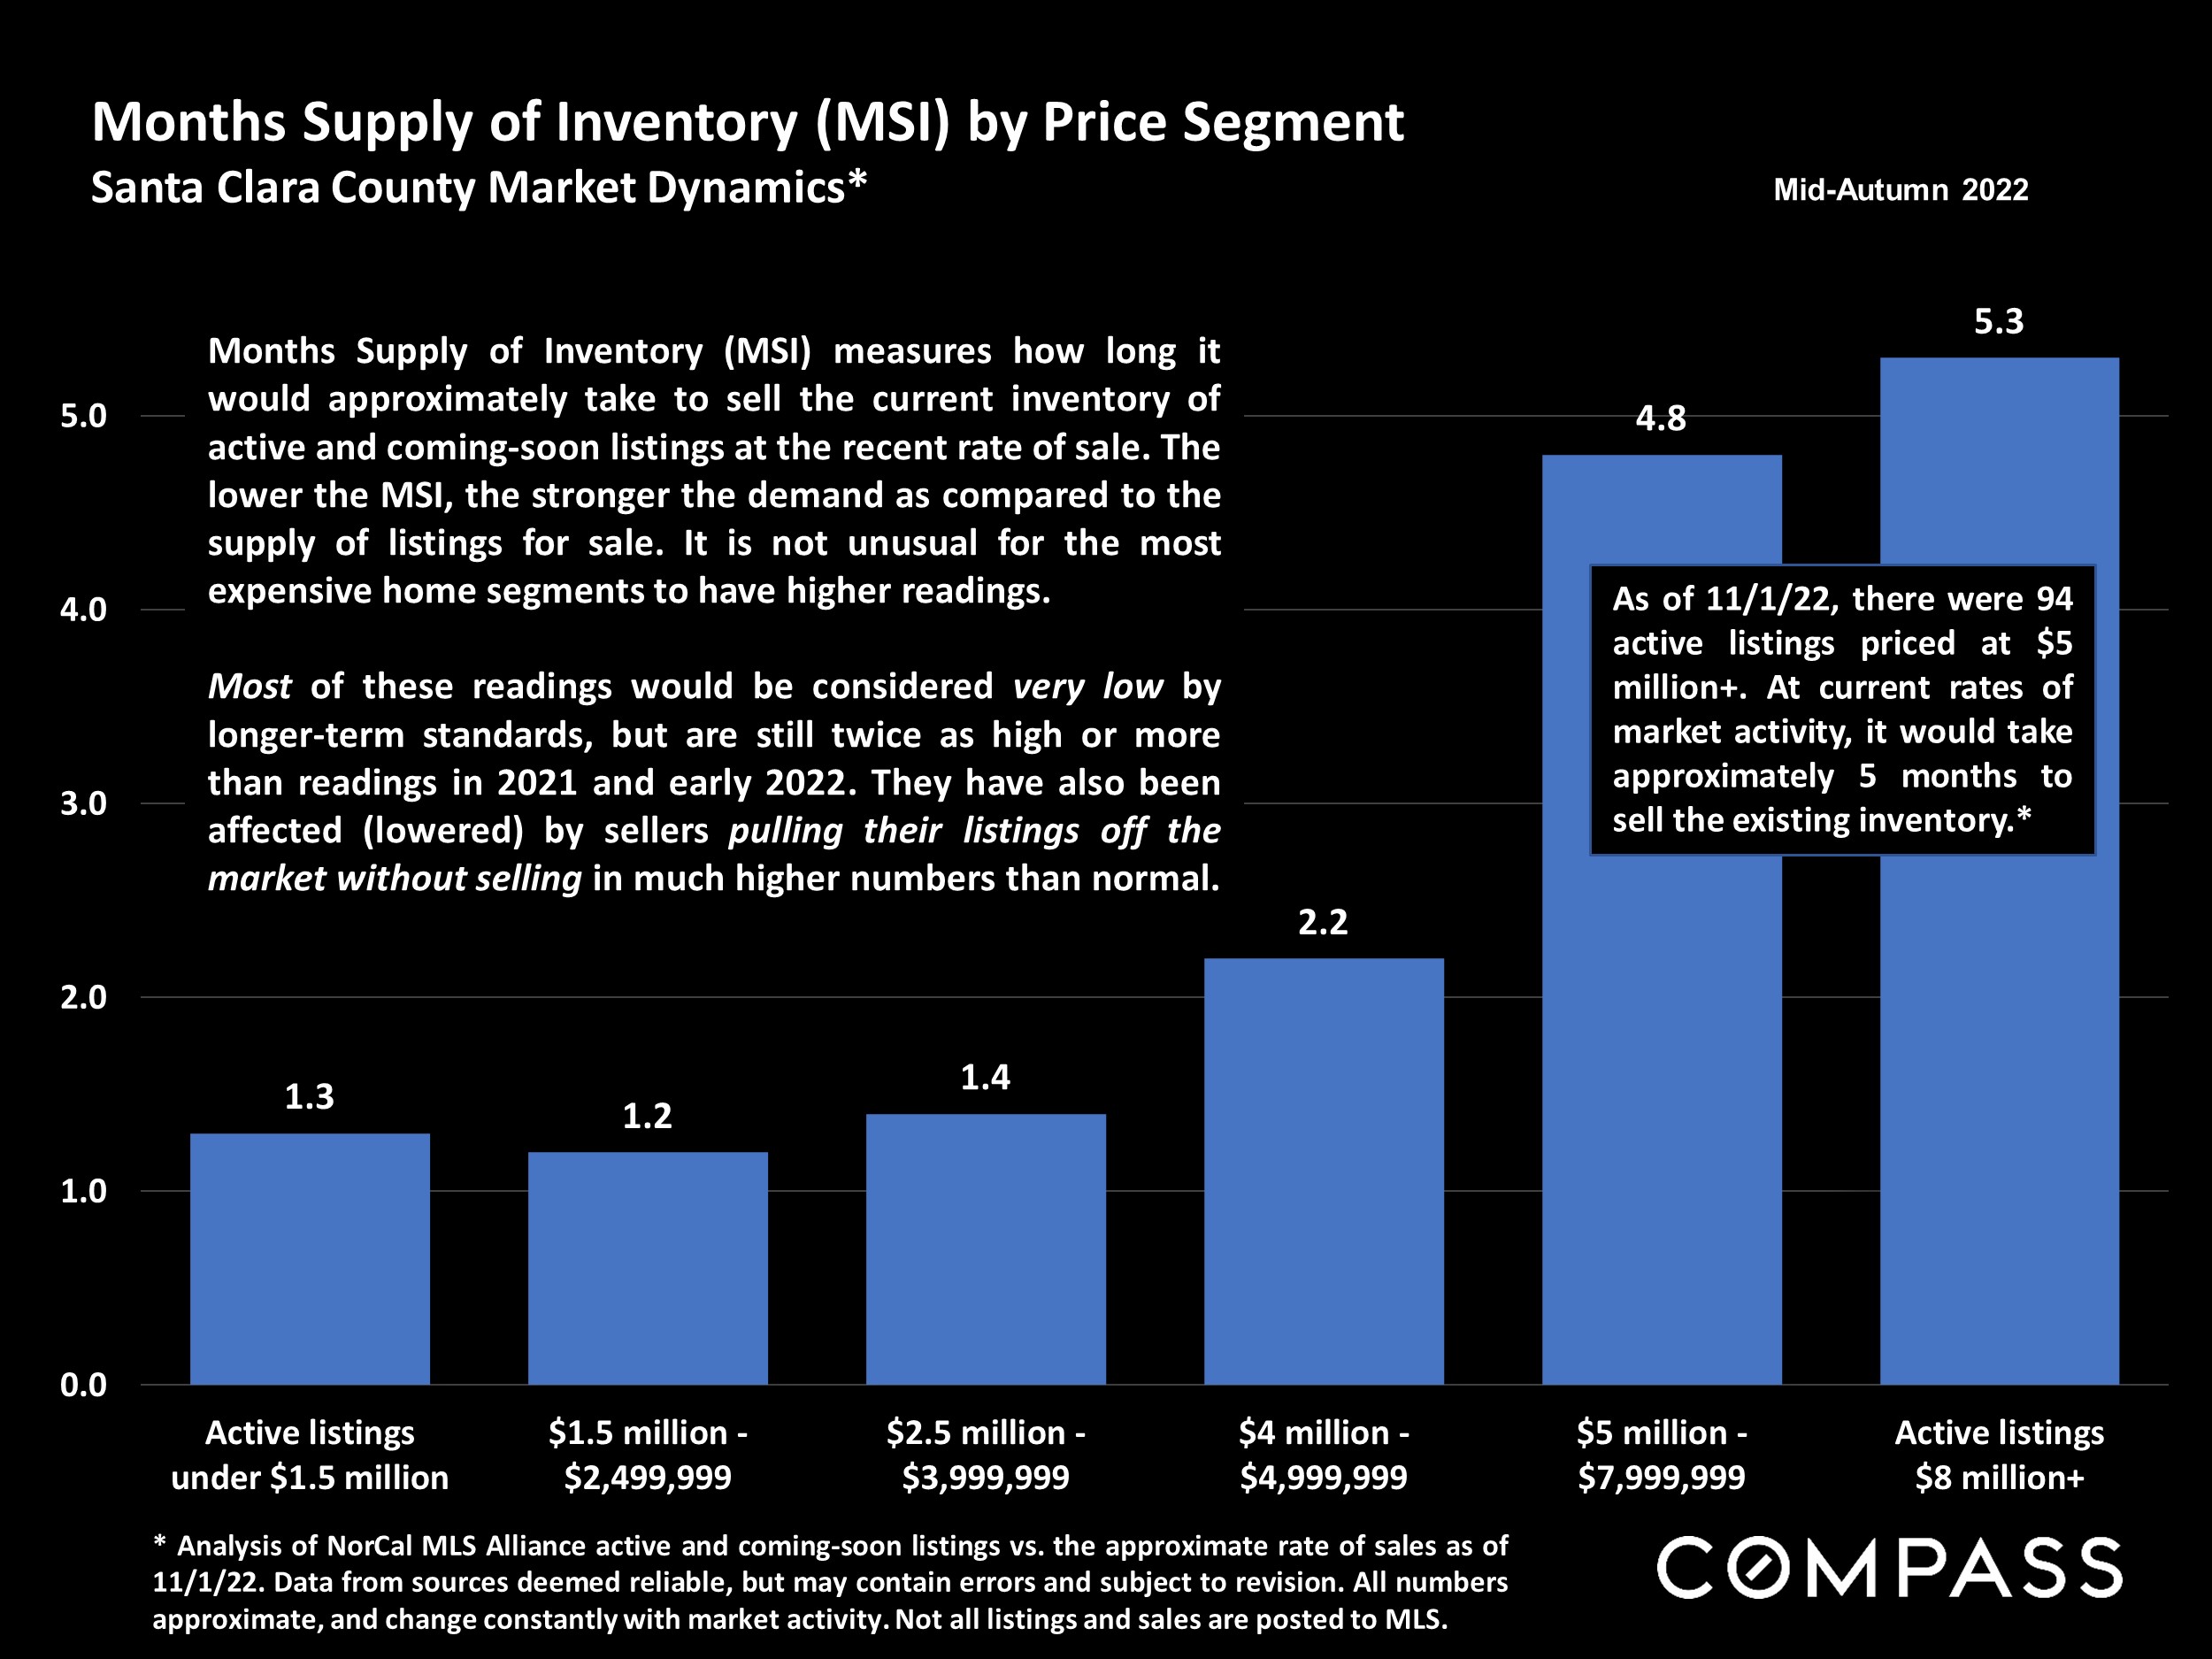
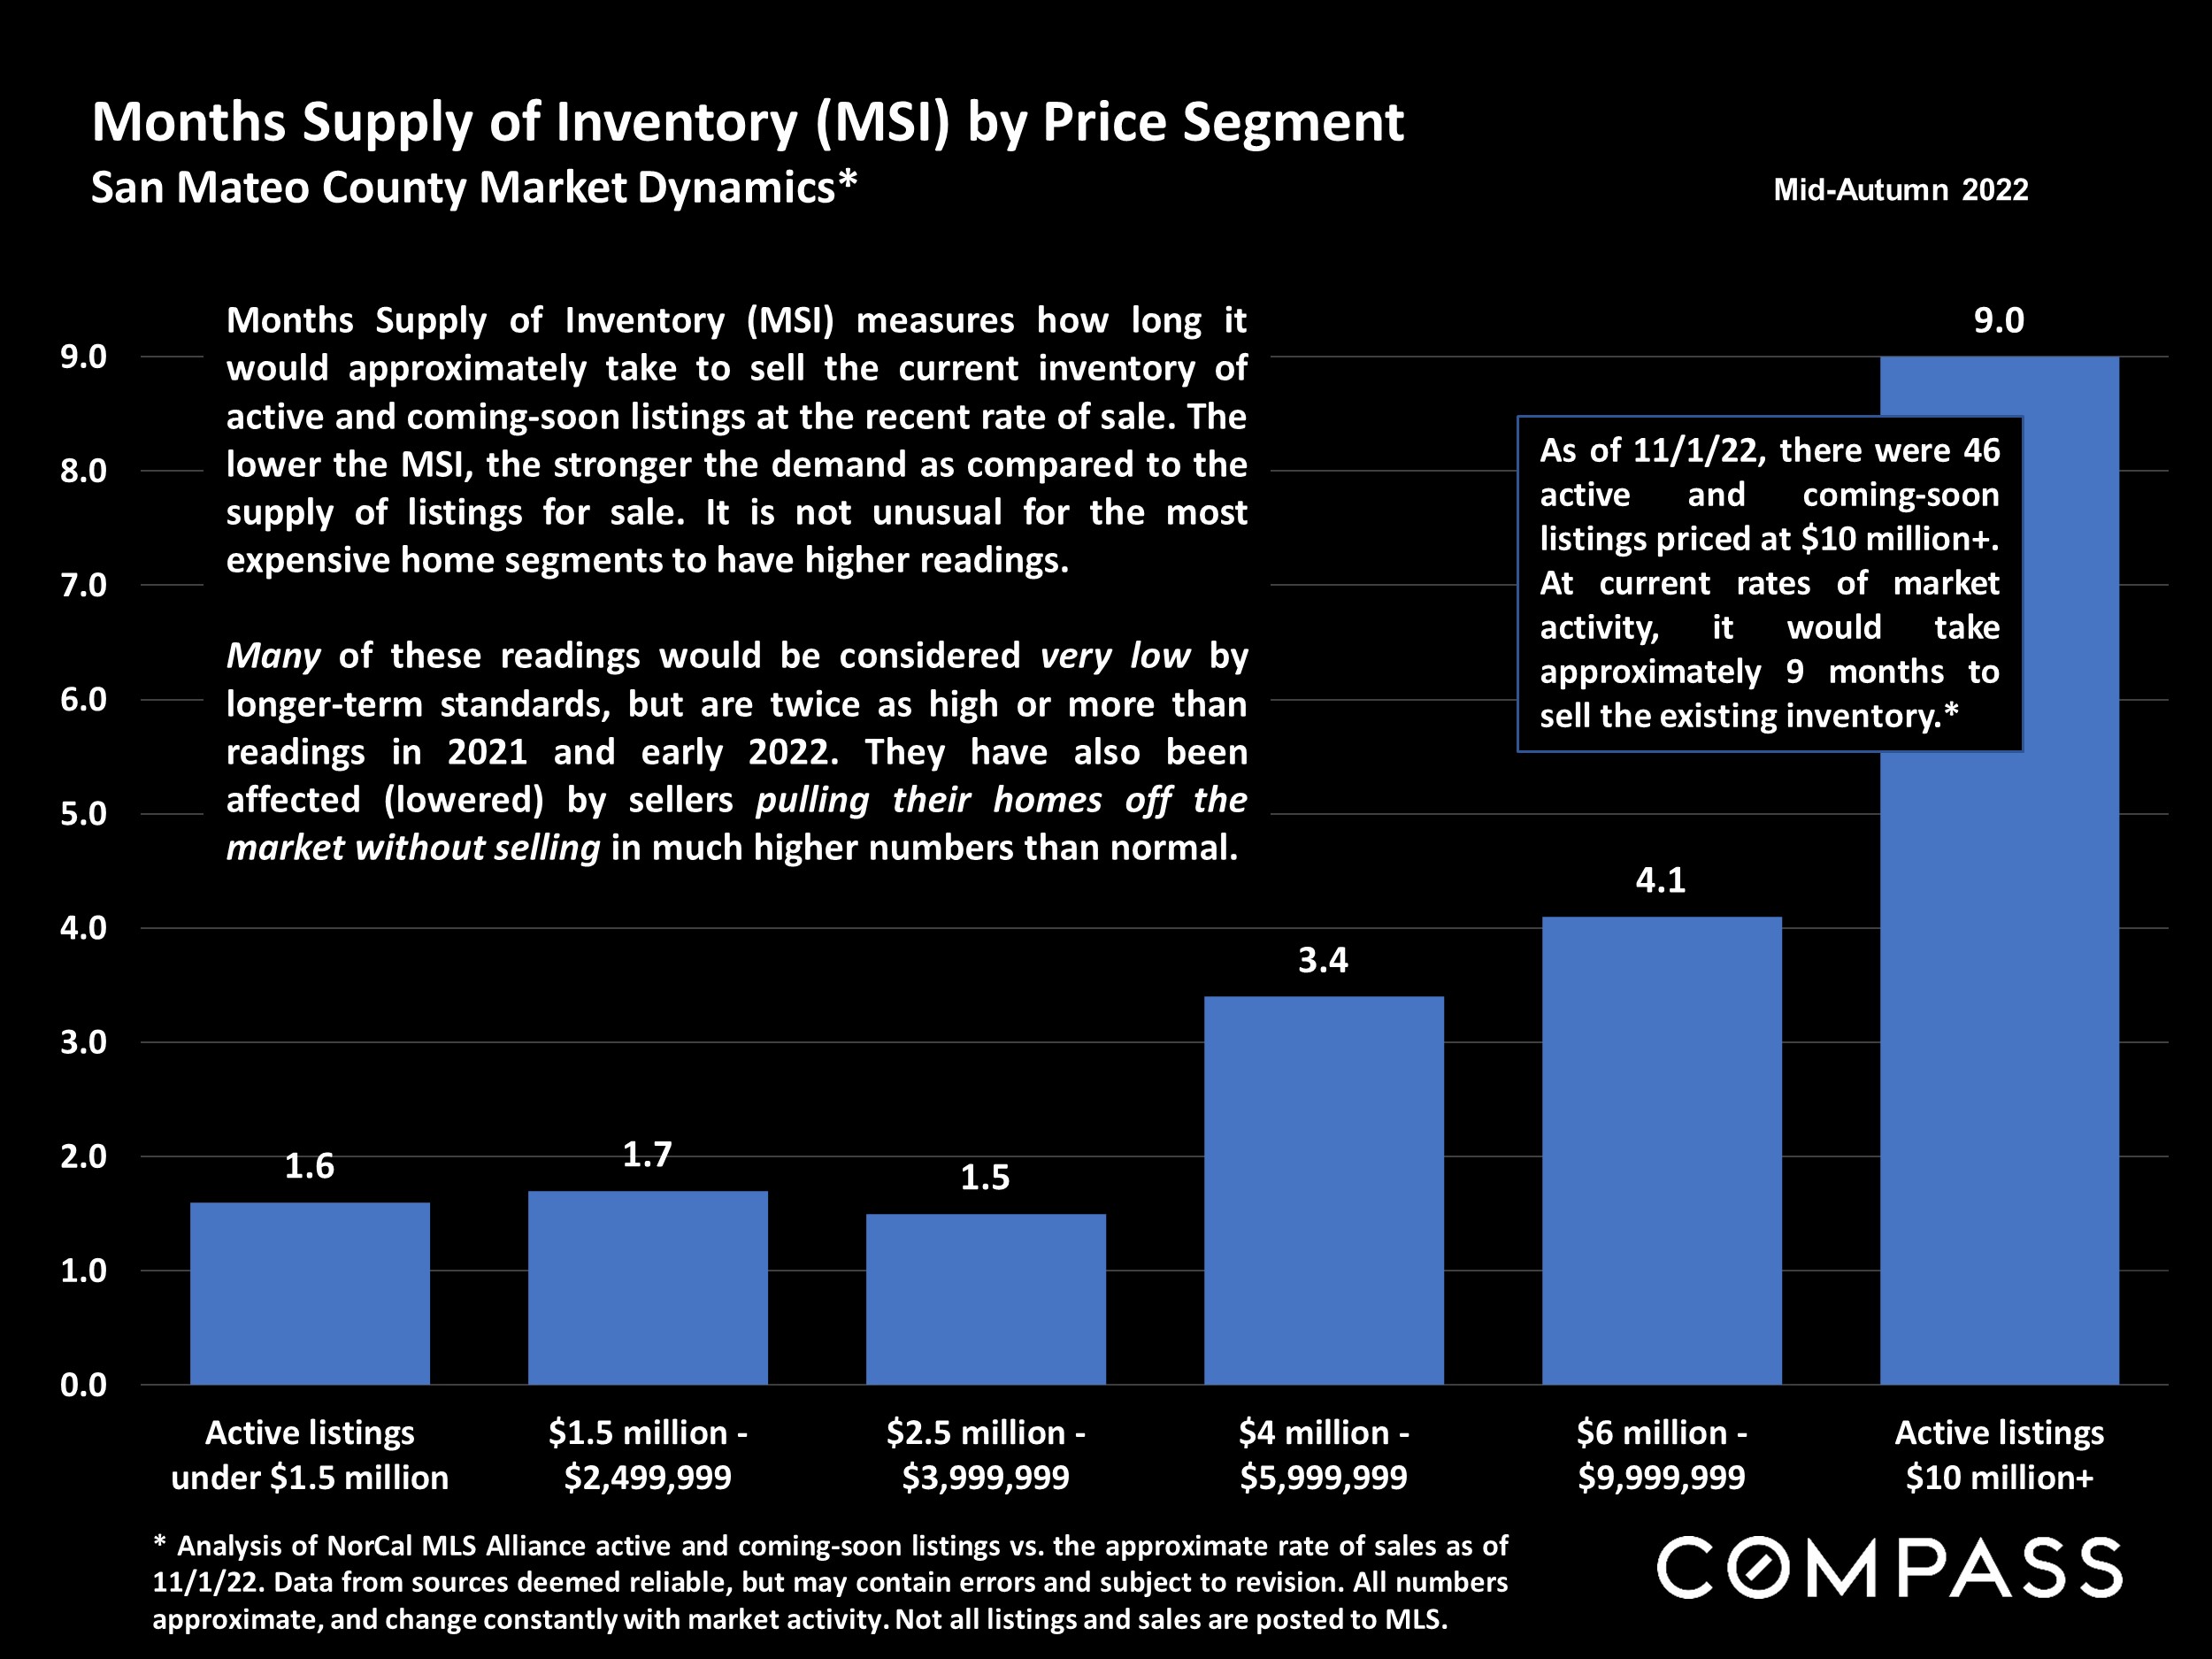
1. Months Supply of Inventory

2. Days on Market
The average days on market is a metric we look at to help understand the velocity of our market. This starts the day it goes active in MLS and stops the day the property goes into contract. In March of this year the average DOM in SMC was 13 and SCC was 12. That number is now around 30 DOM in SMC and 27 in SCC. While this extra time might feel nerve wracking to a seller, it does provide buyers more time to perform diligence and make a decision.
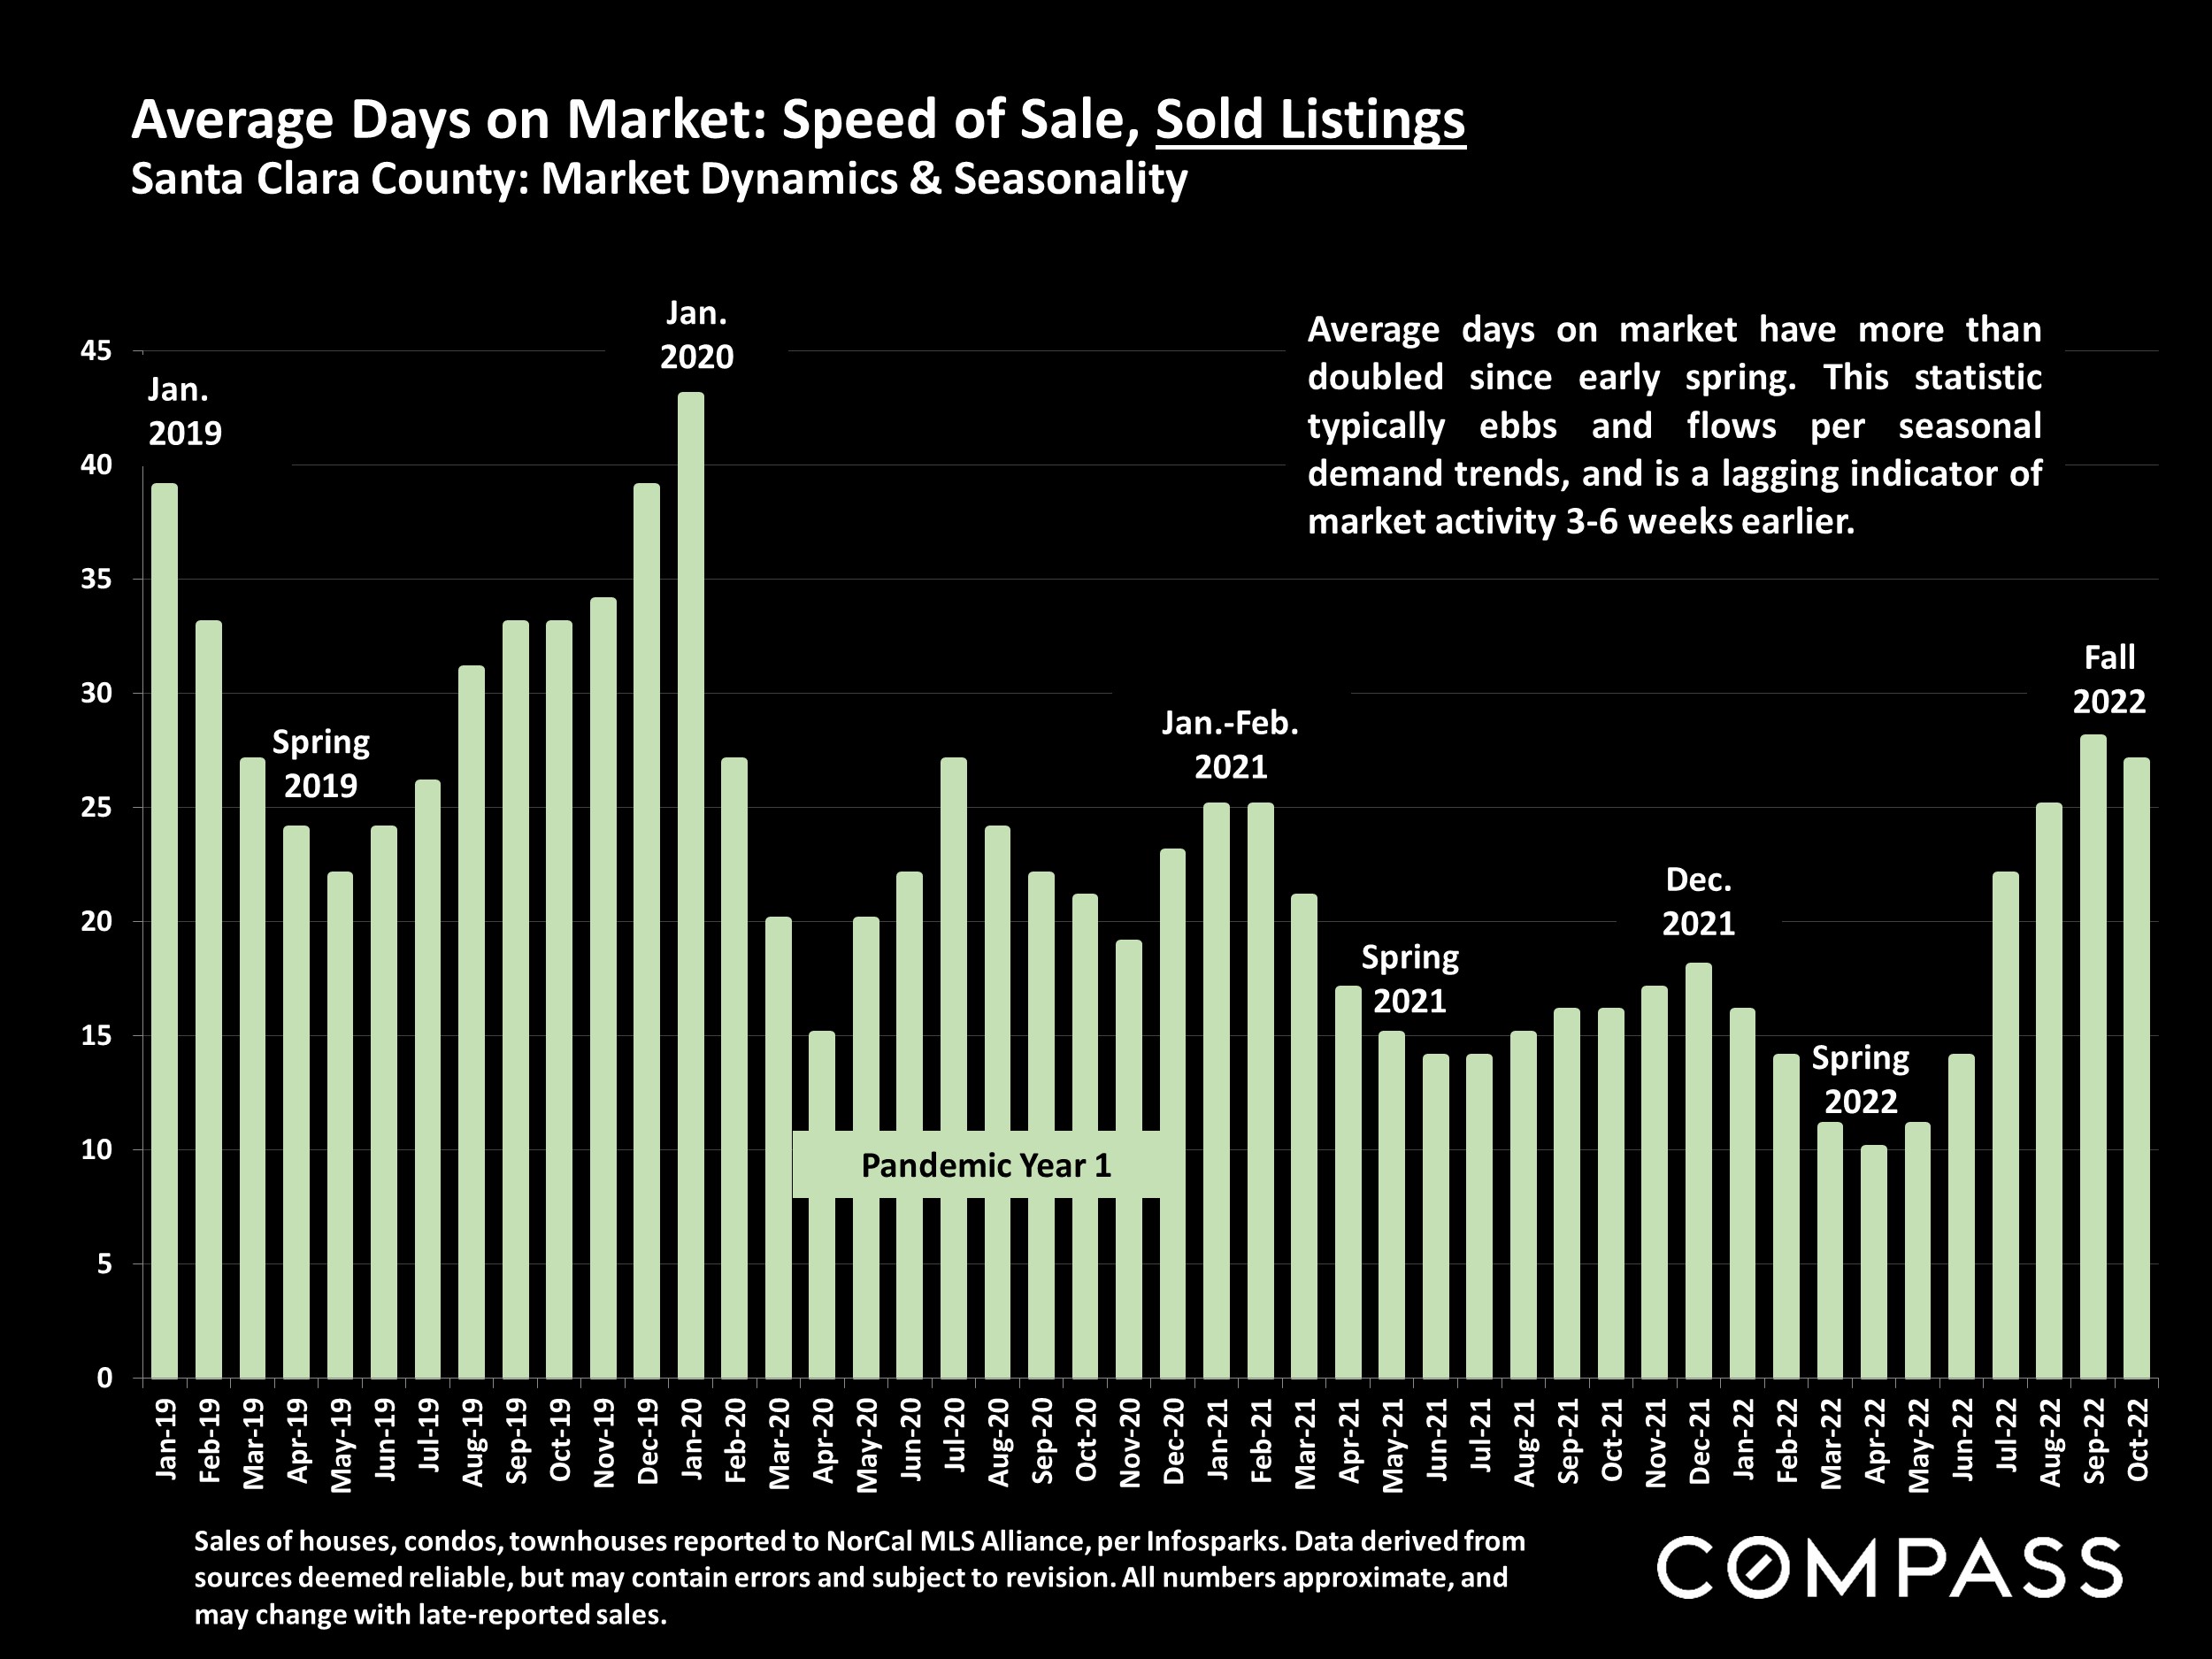
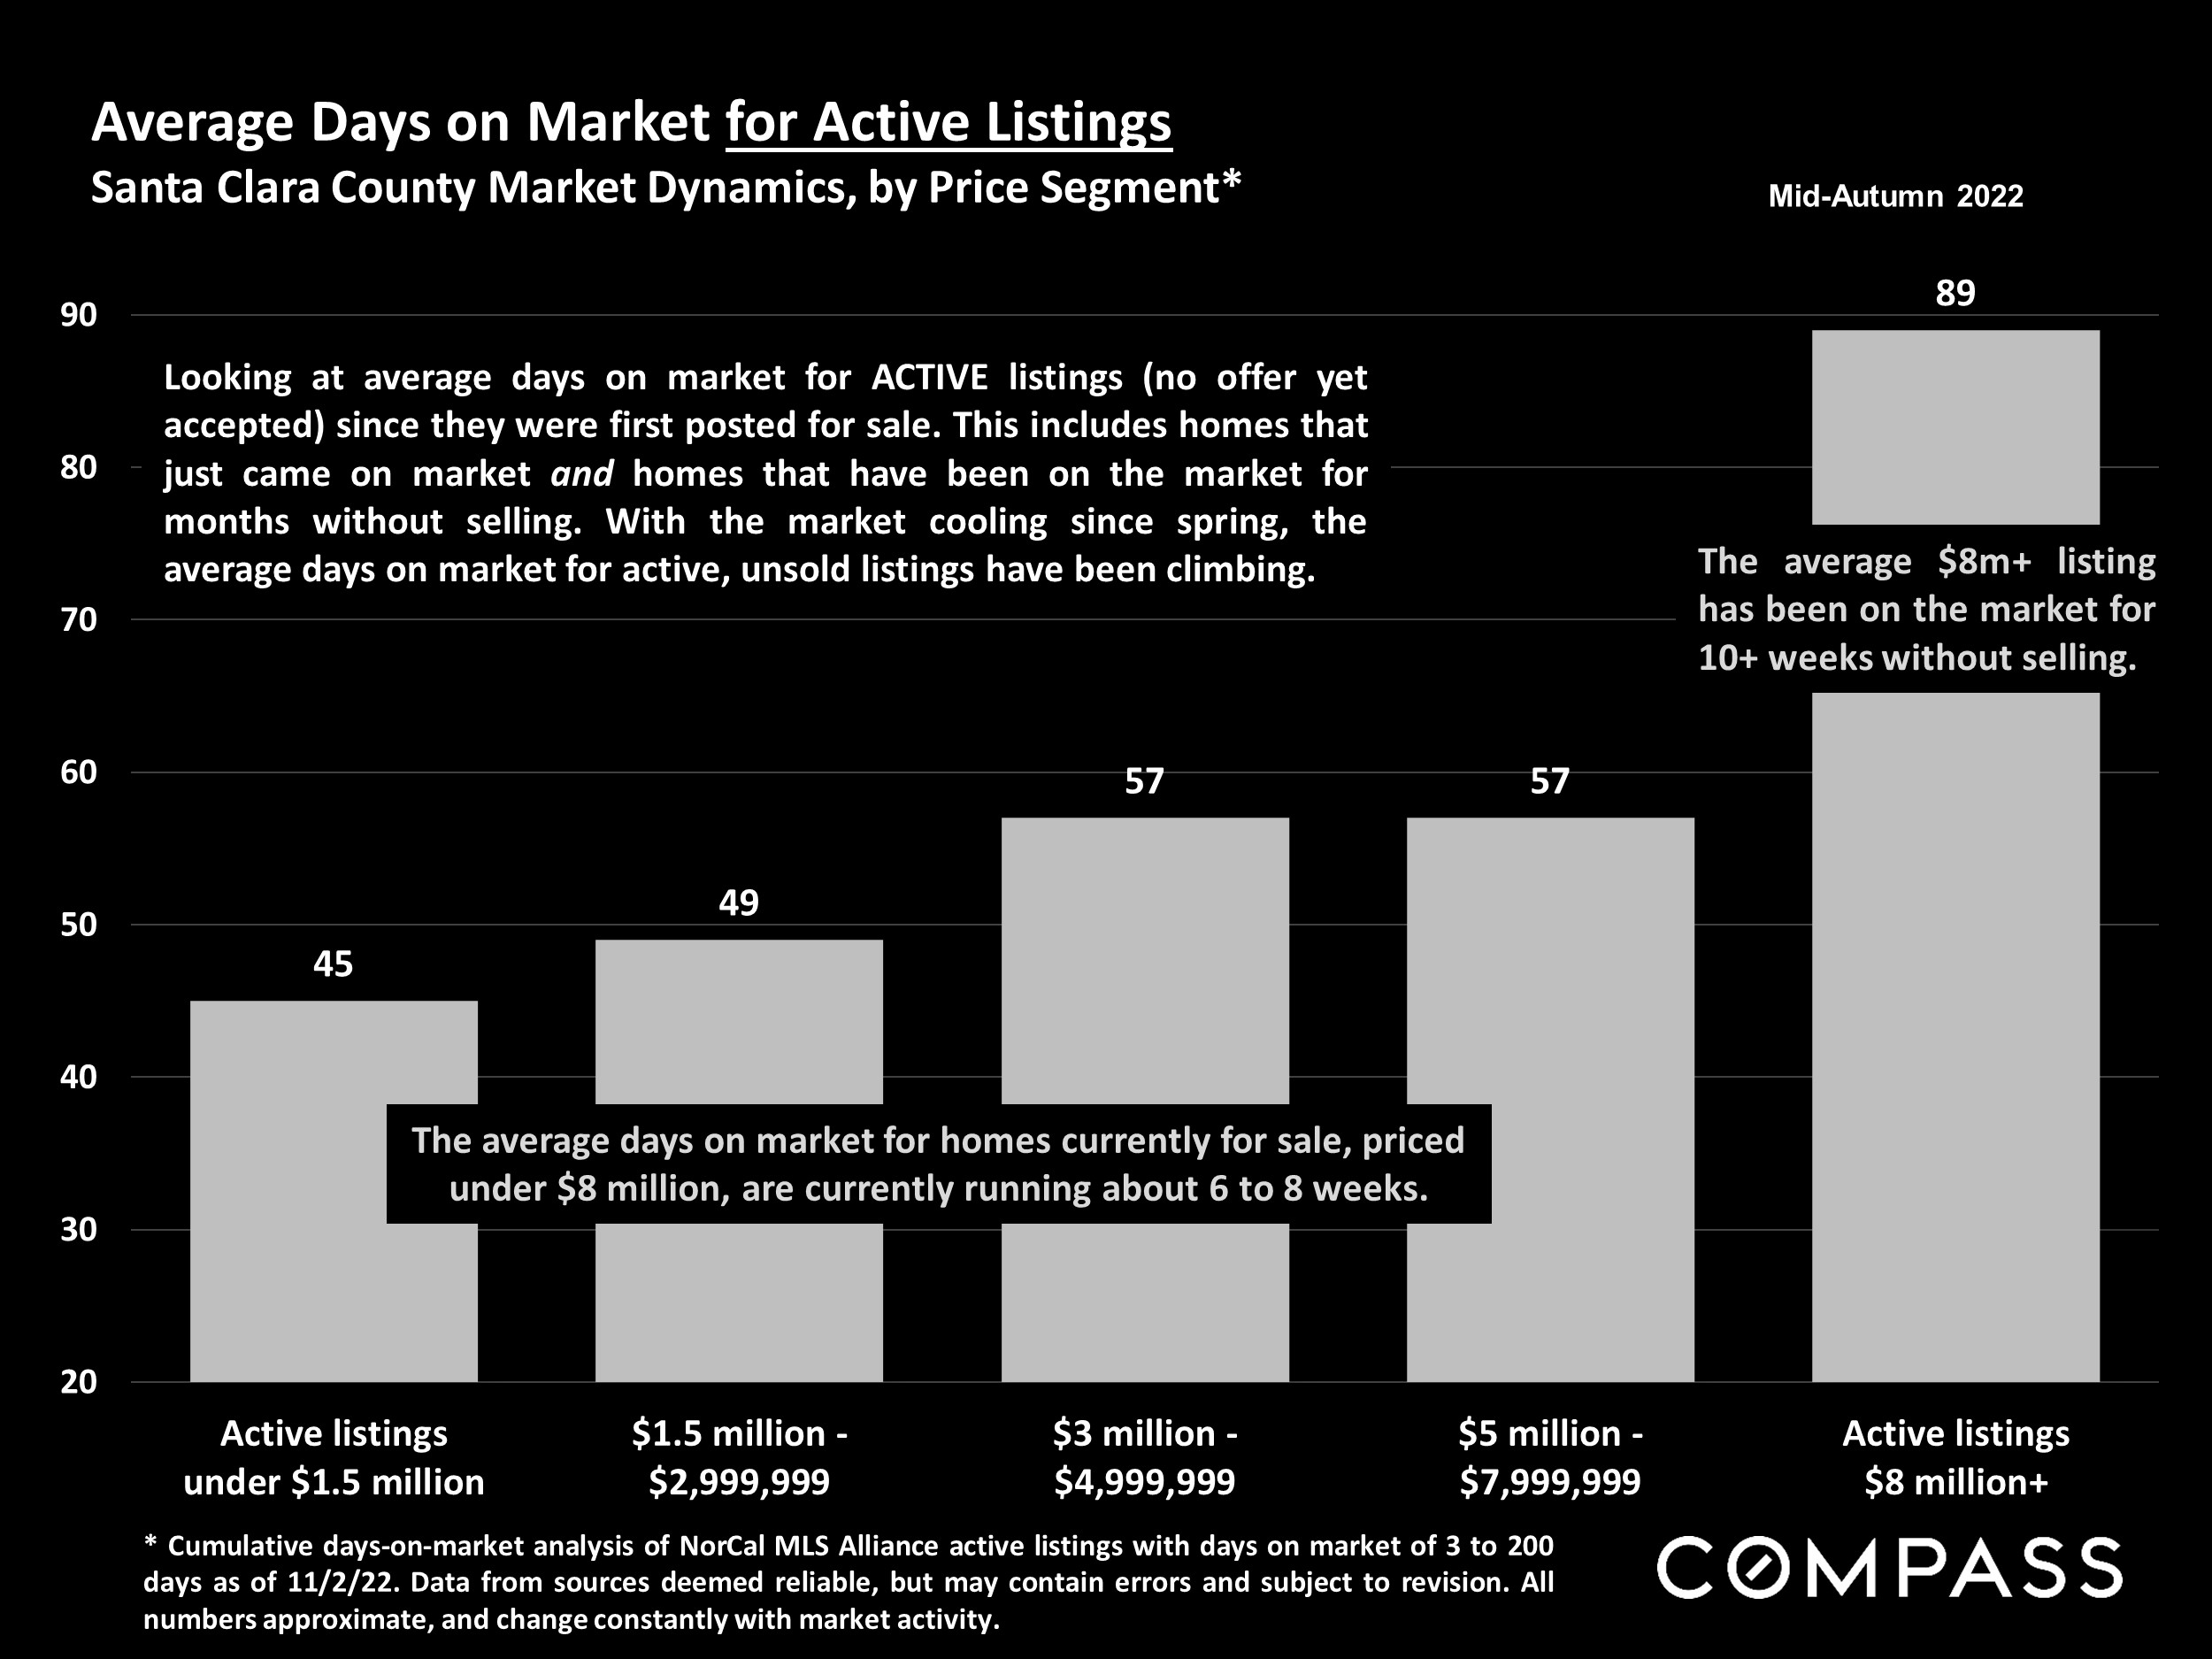
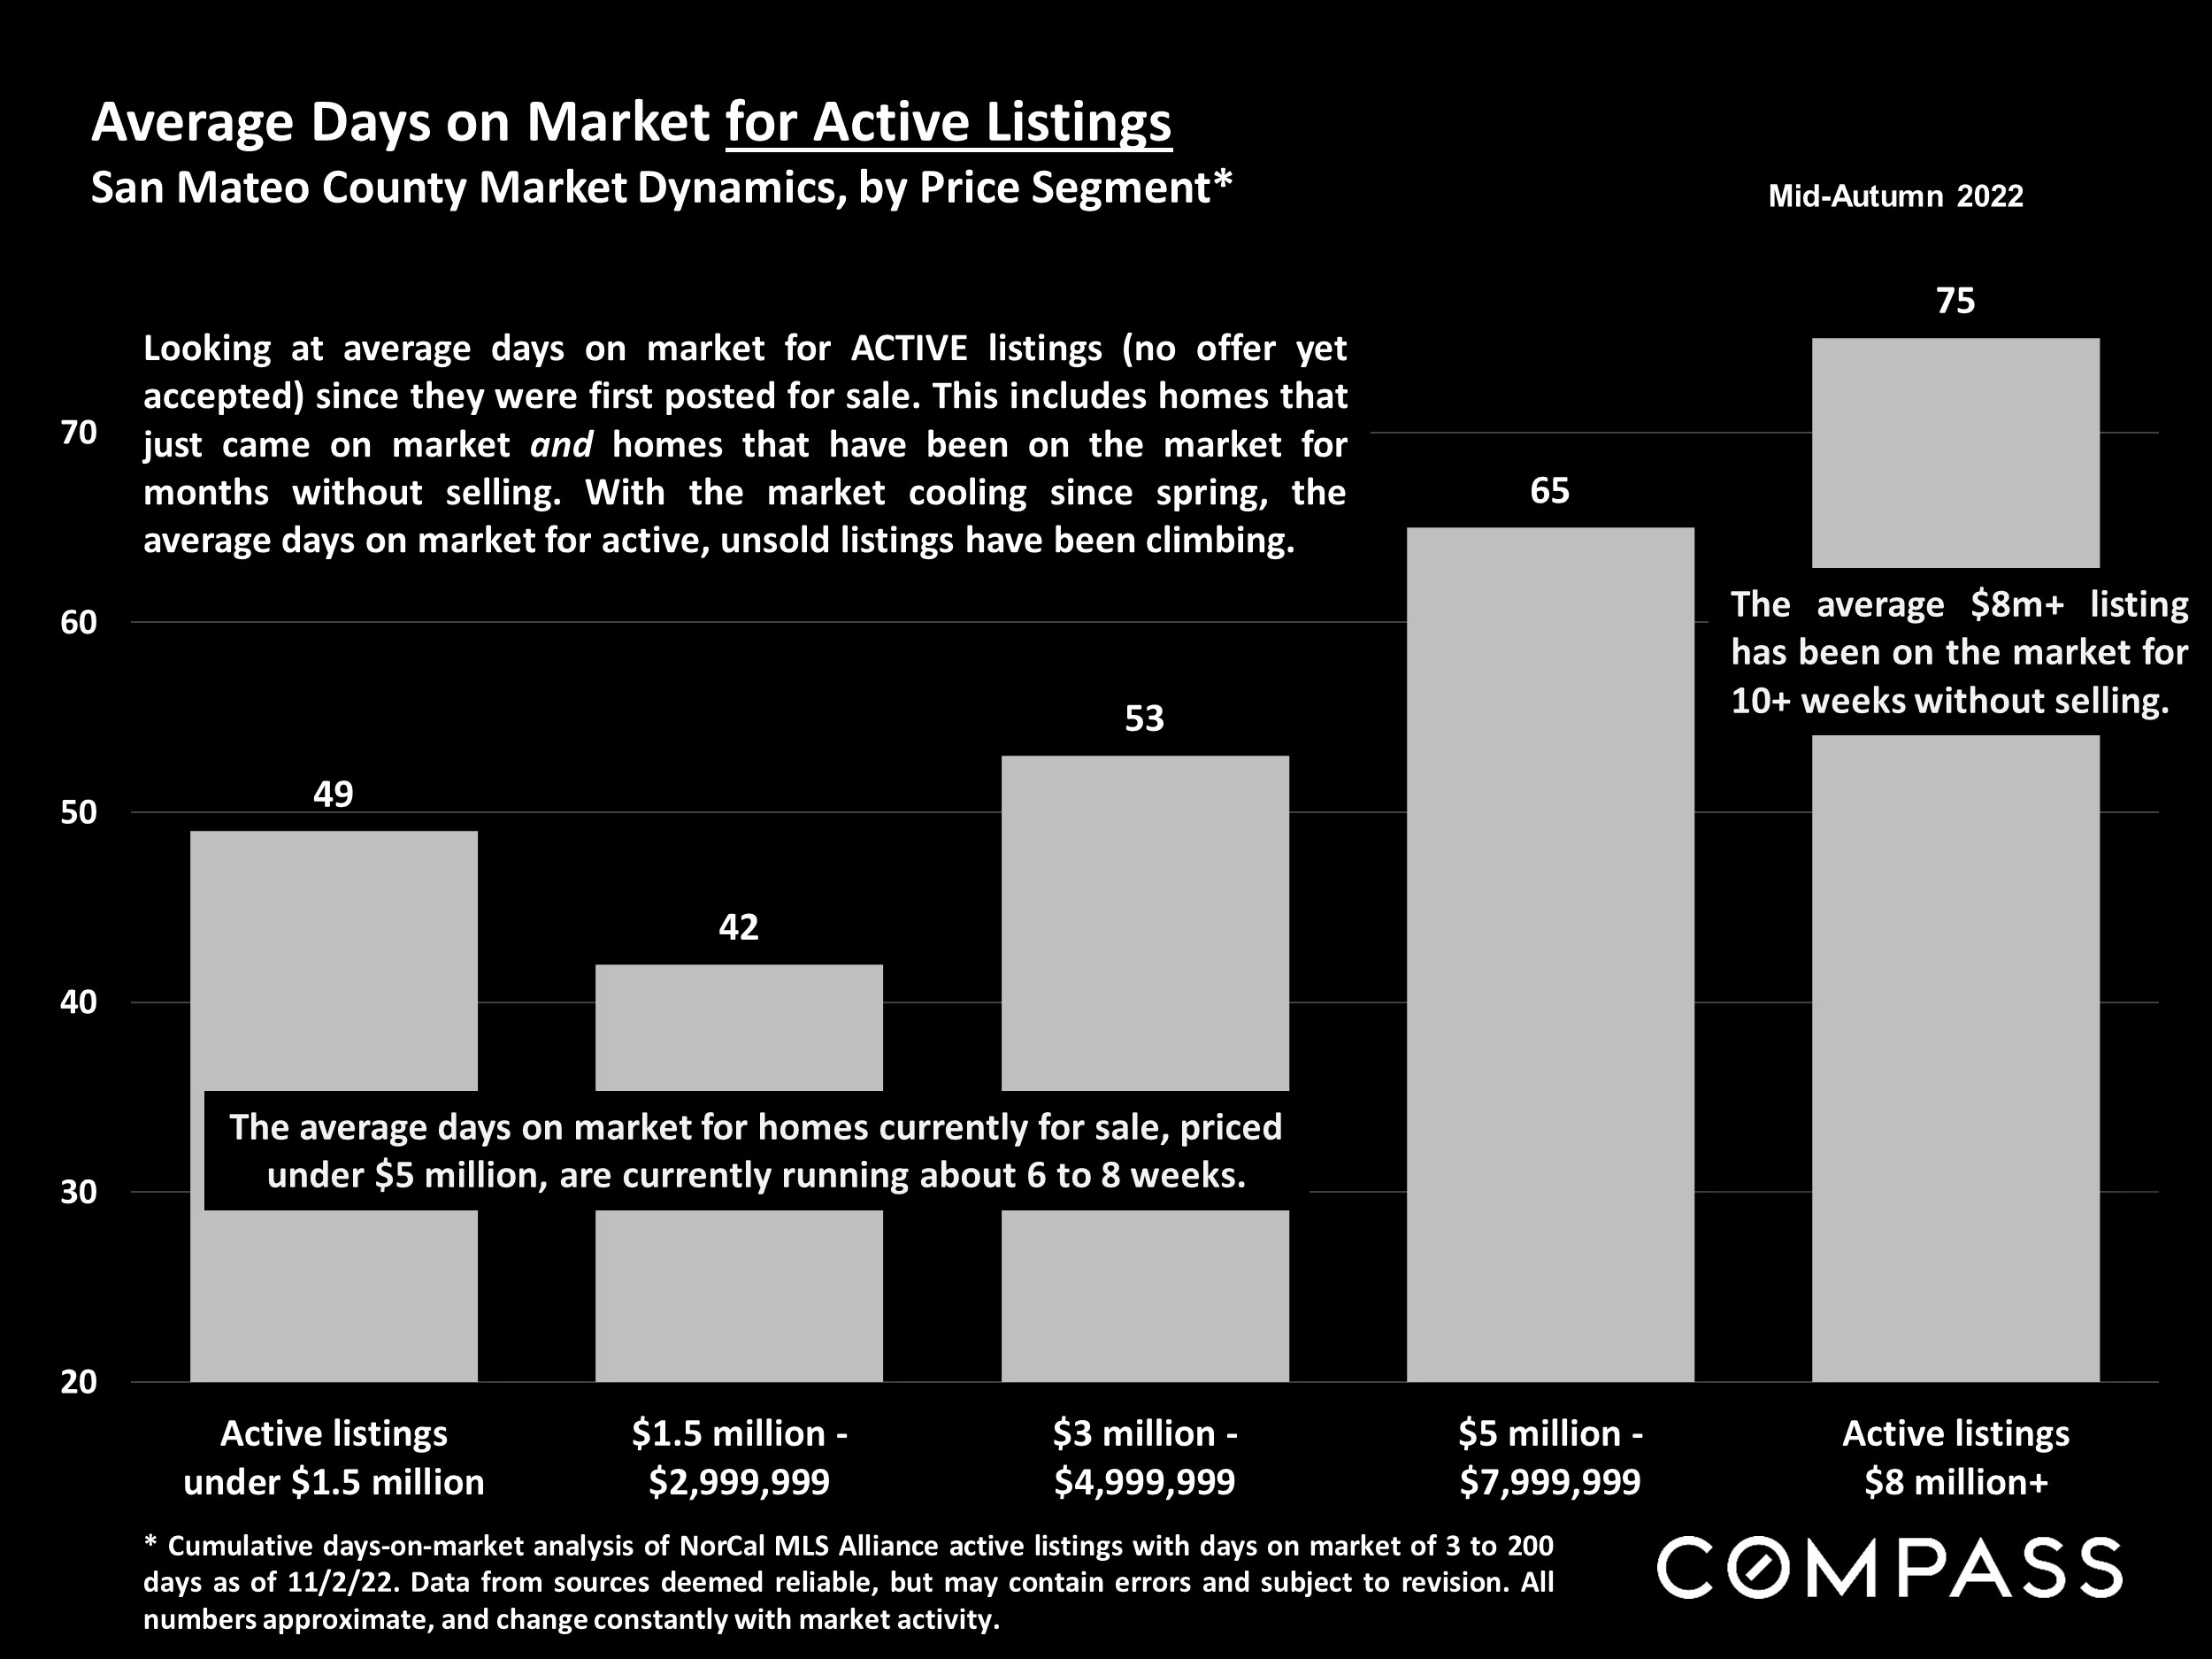
Instead of looking back at this metric, this DOM chart looks at the current inventory by price point. This generally correlates with the MSI breakdown by pricepoint as well. Once again DOM is less at the lower price points.
3. Pricing
Evaluating the median price of sales over time is one of the best ways we have to track how prices are moving. This month we’re looking at median price over the long term (see our October update for monthly Year over Year analysis). Based on this rolling 3 month average on a year to year perspective in SCC prices are roughly the same as this time last year, and in SMC median price is down 4% from same time last year.
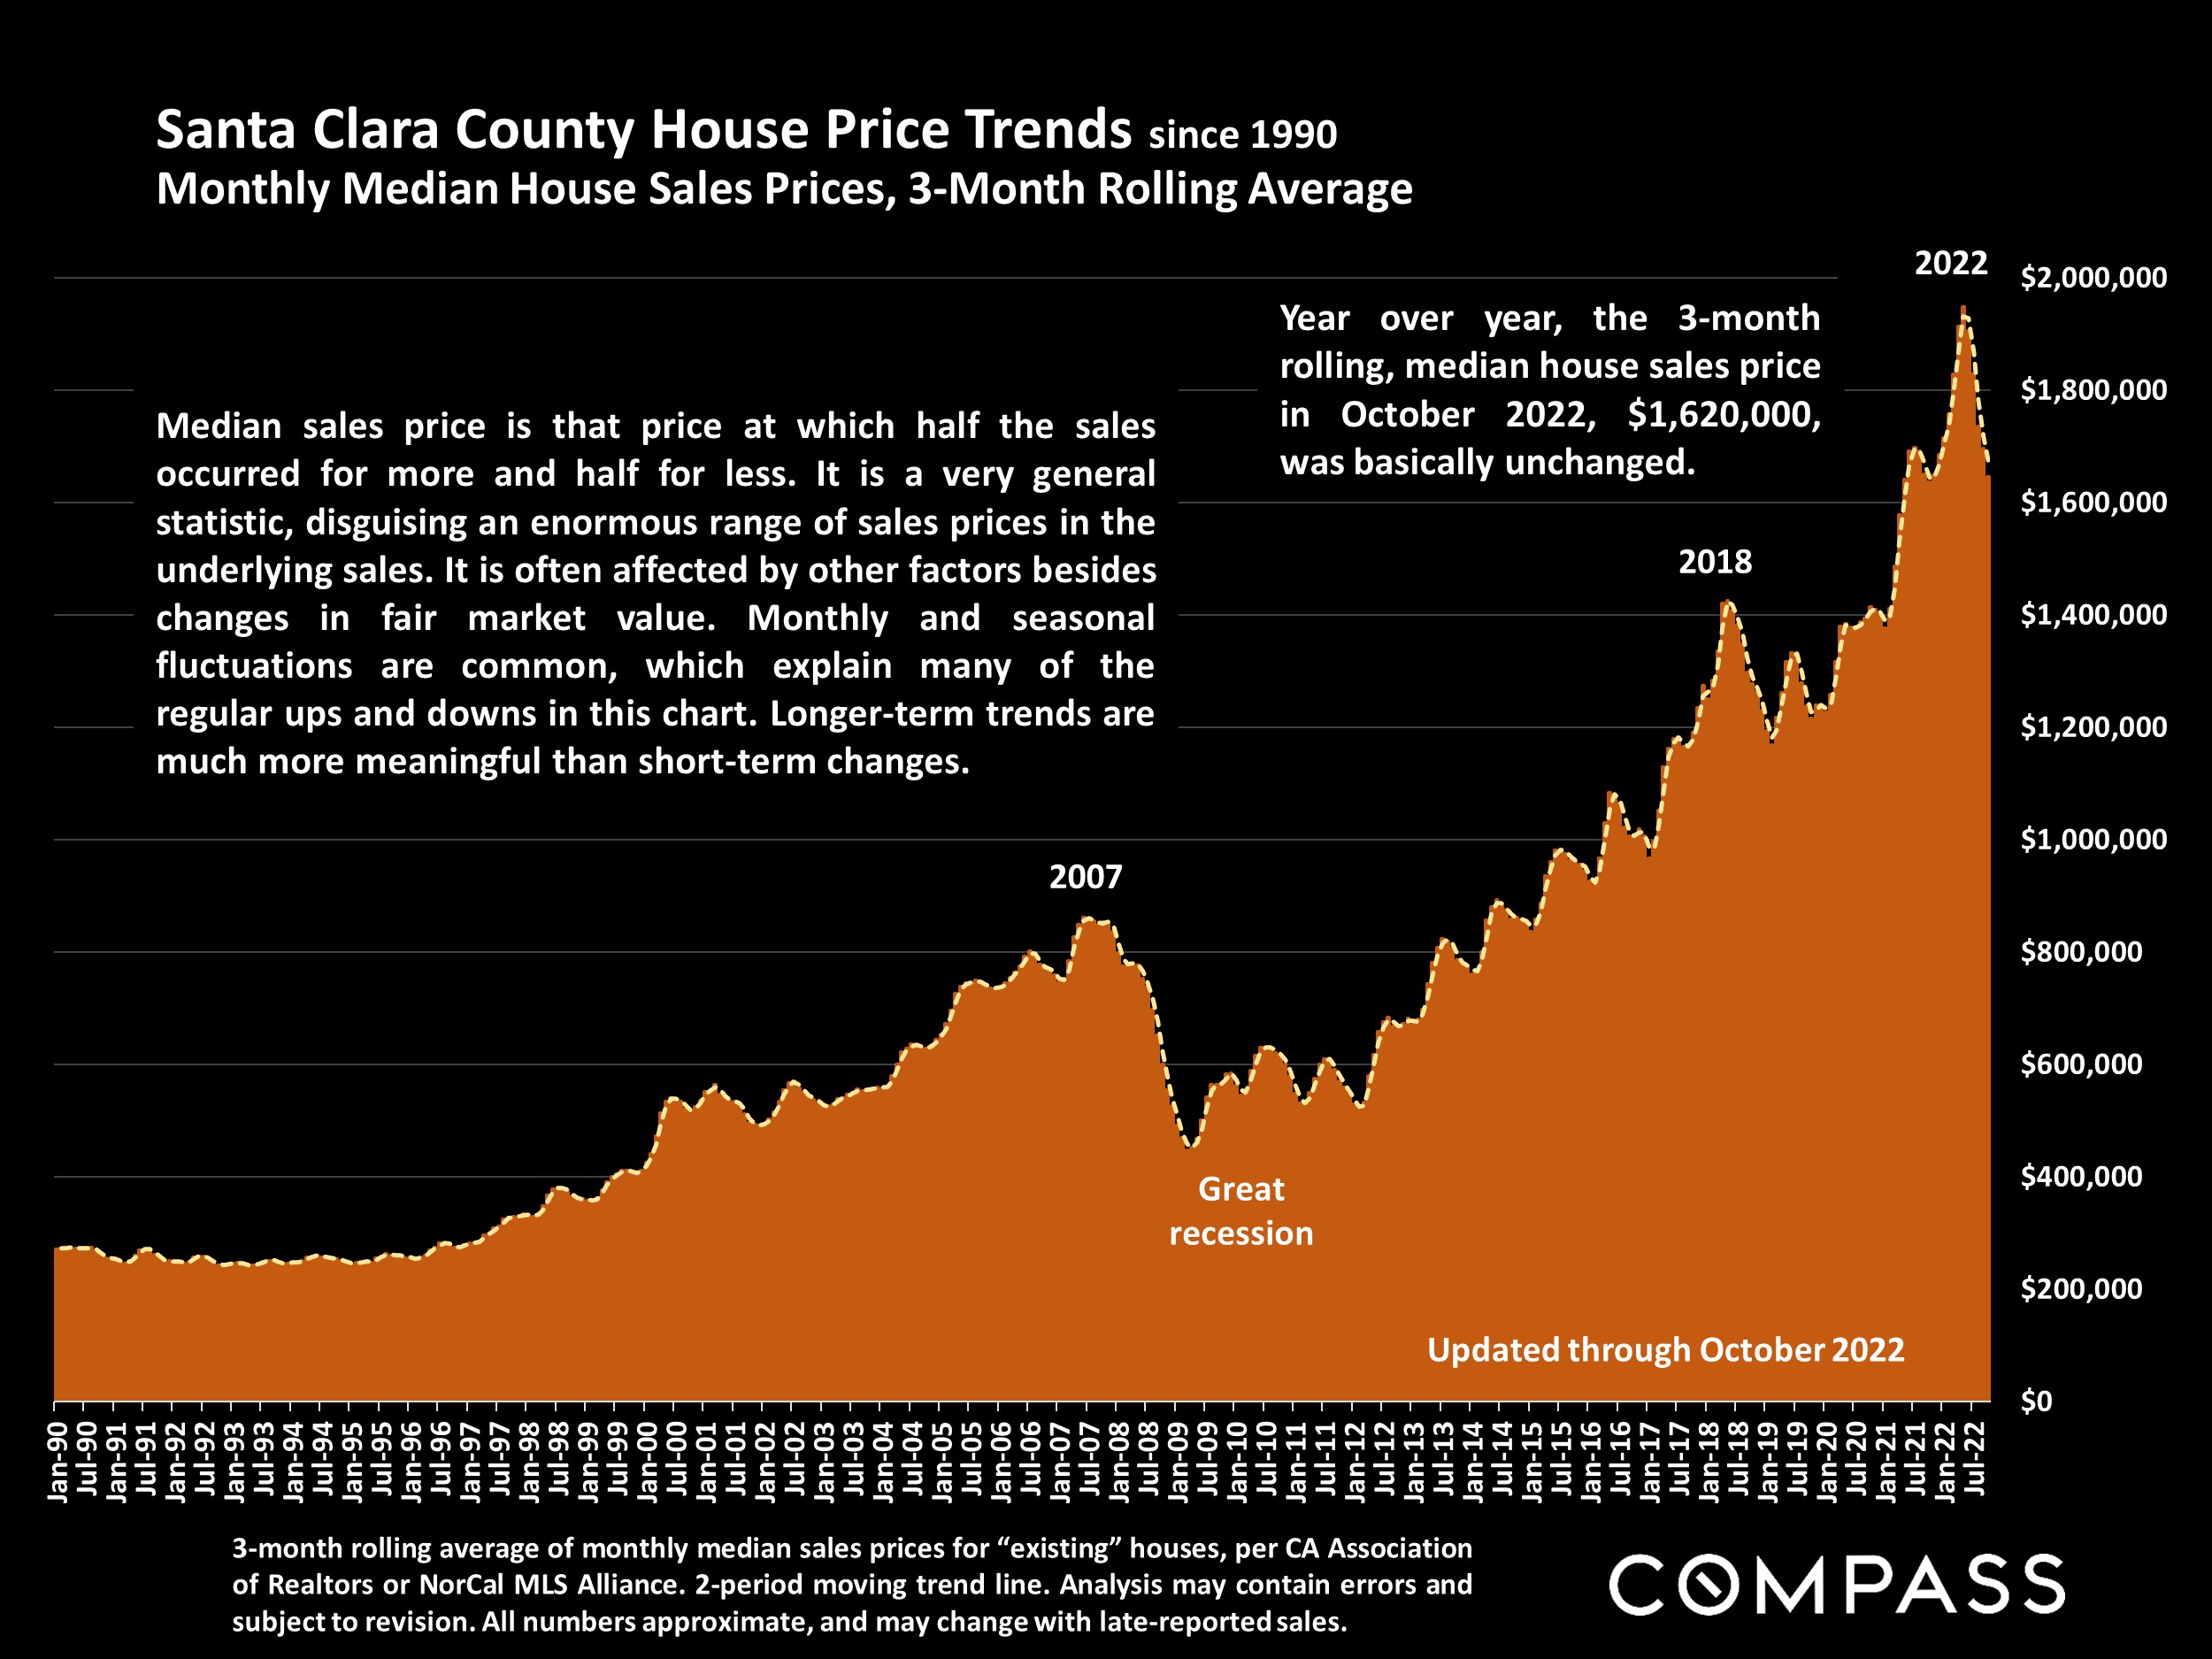
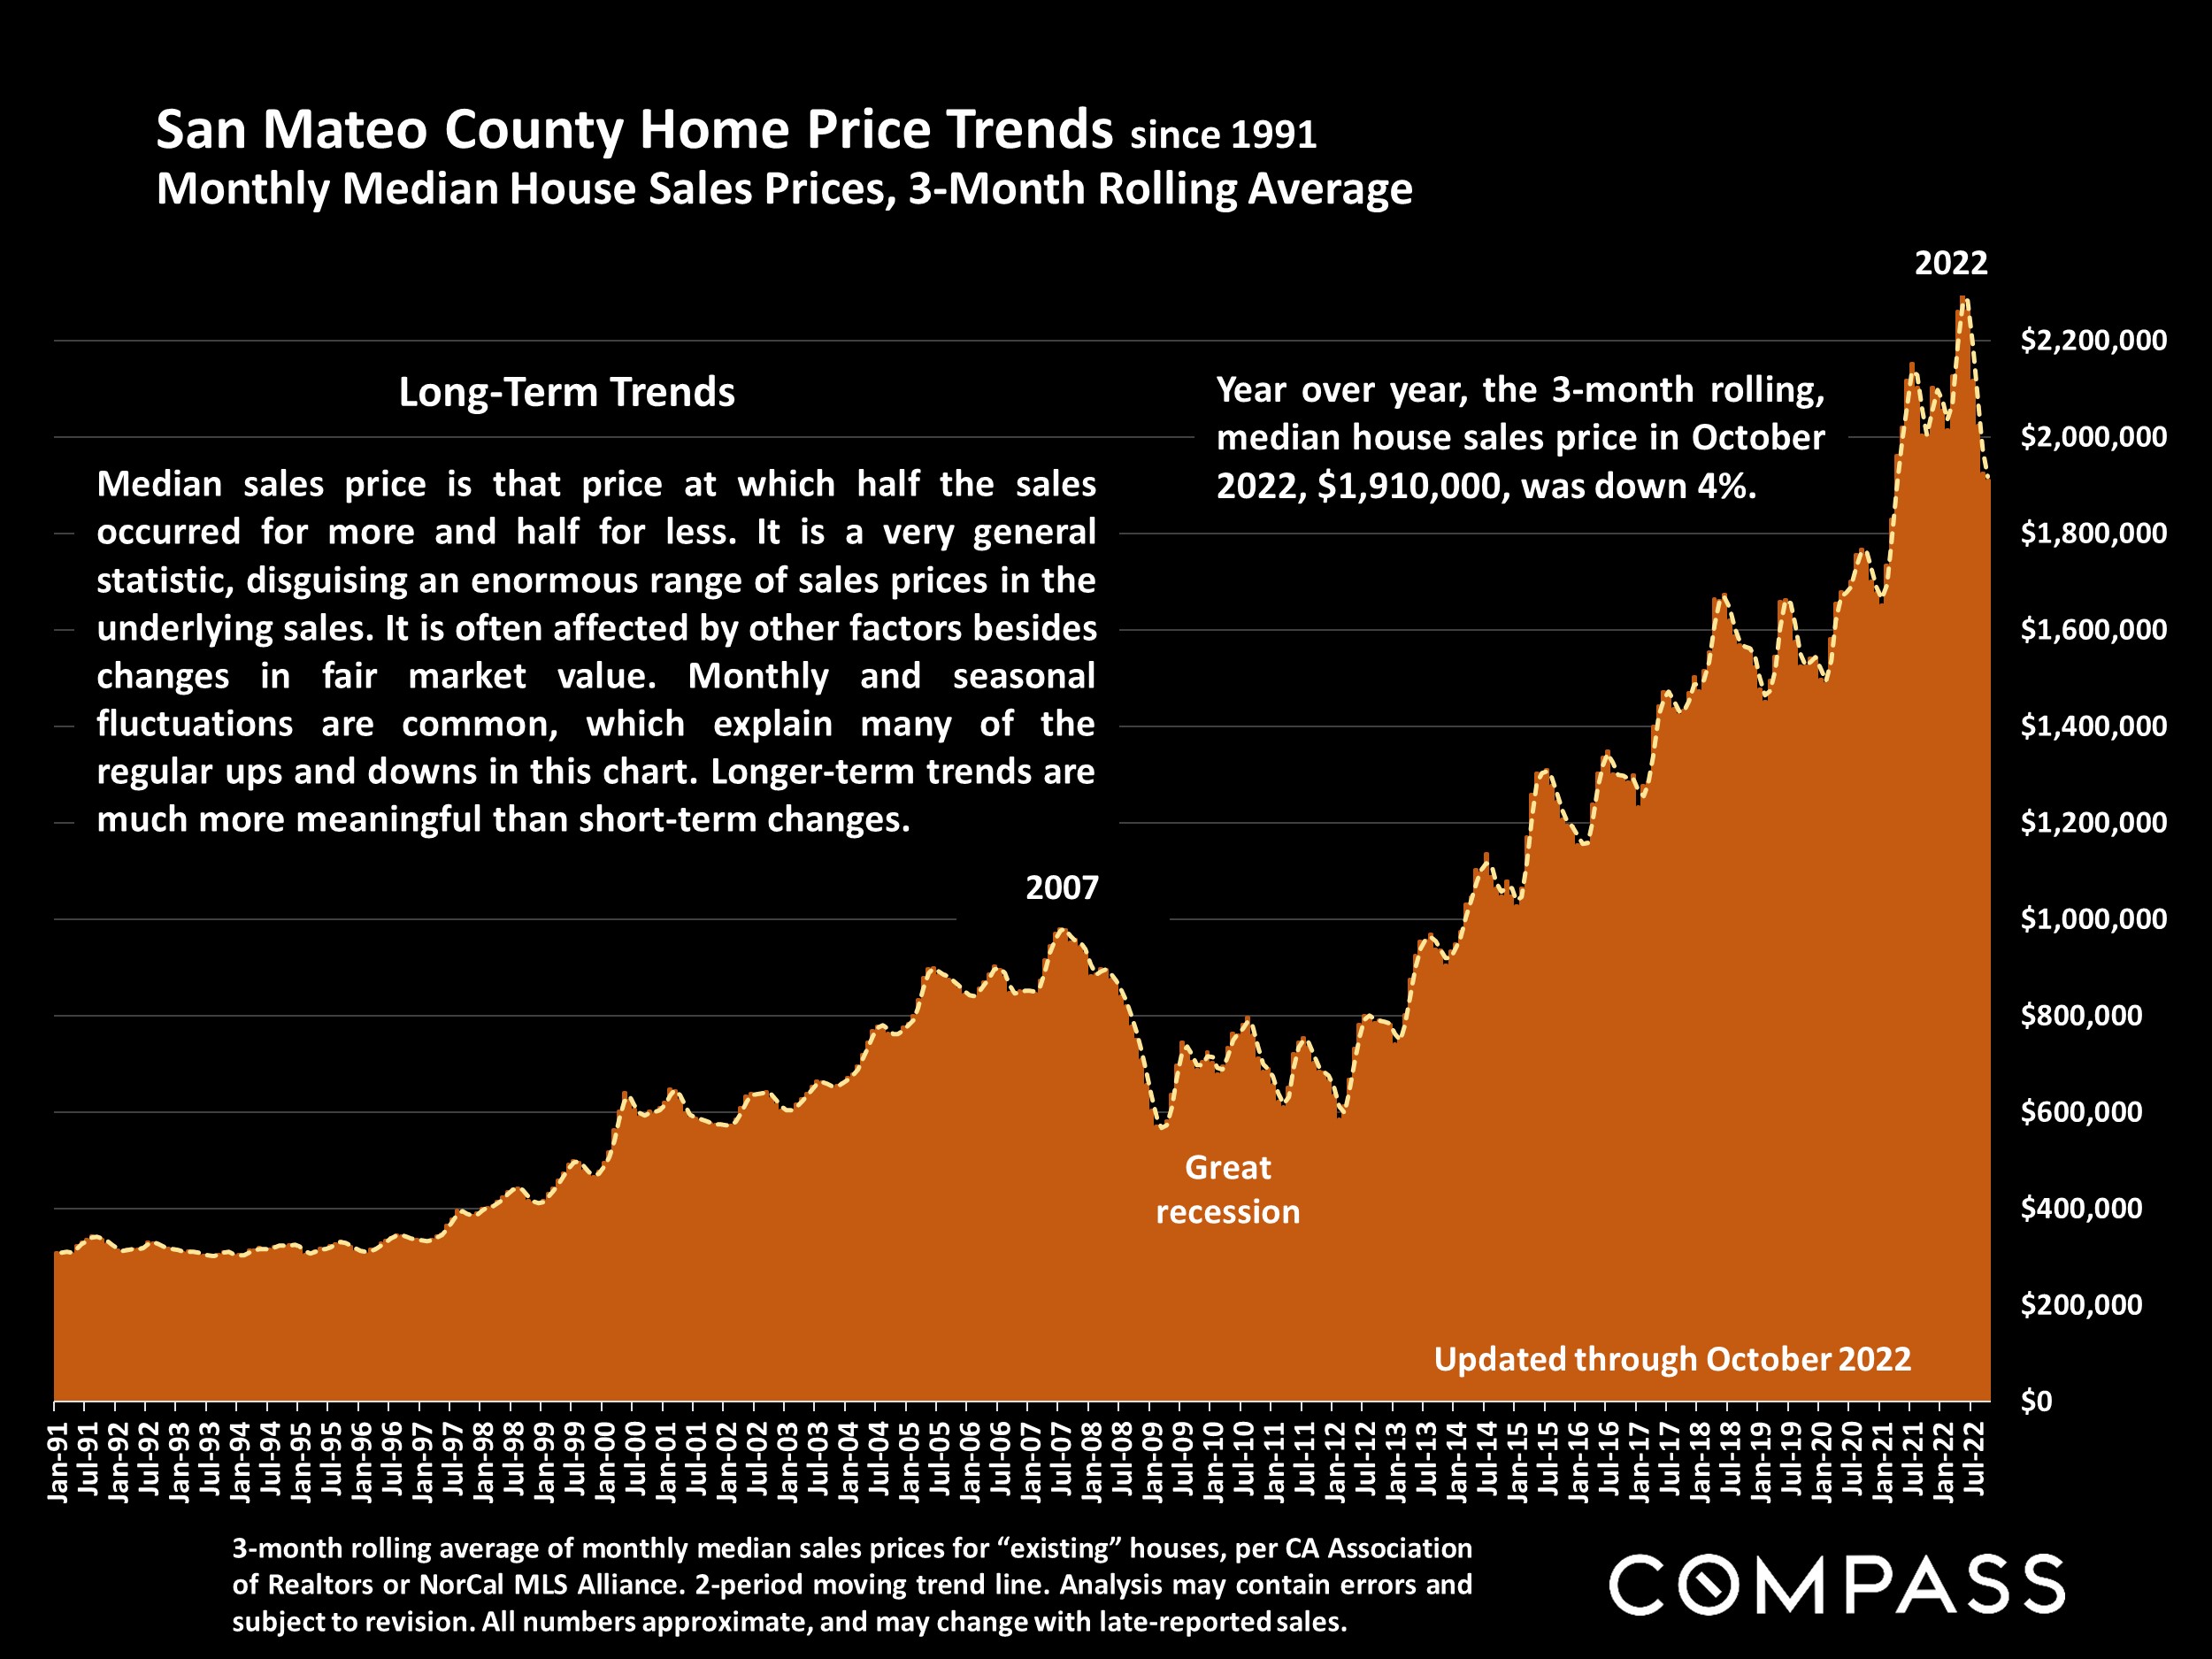
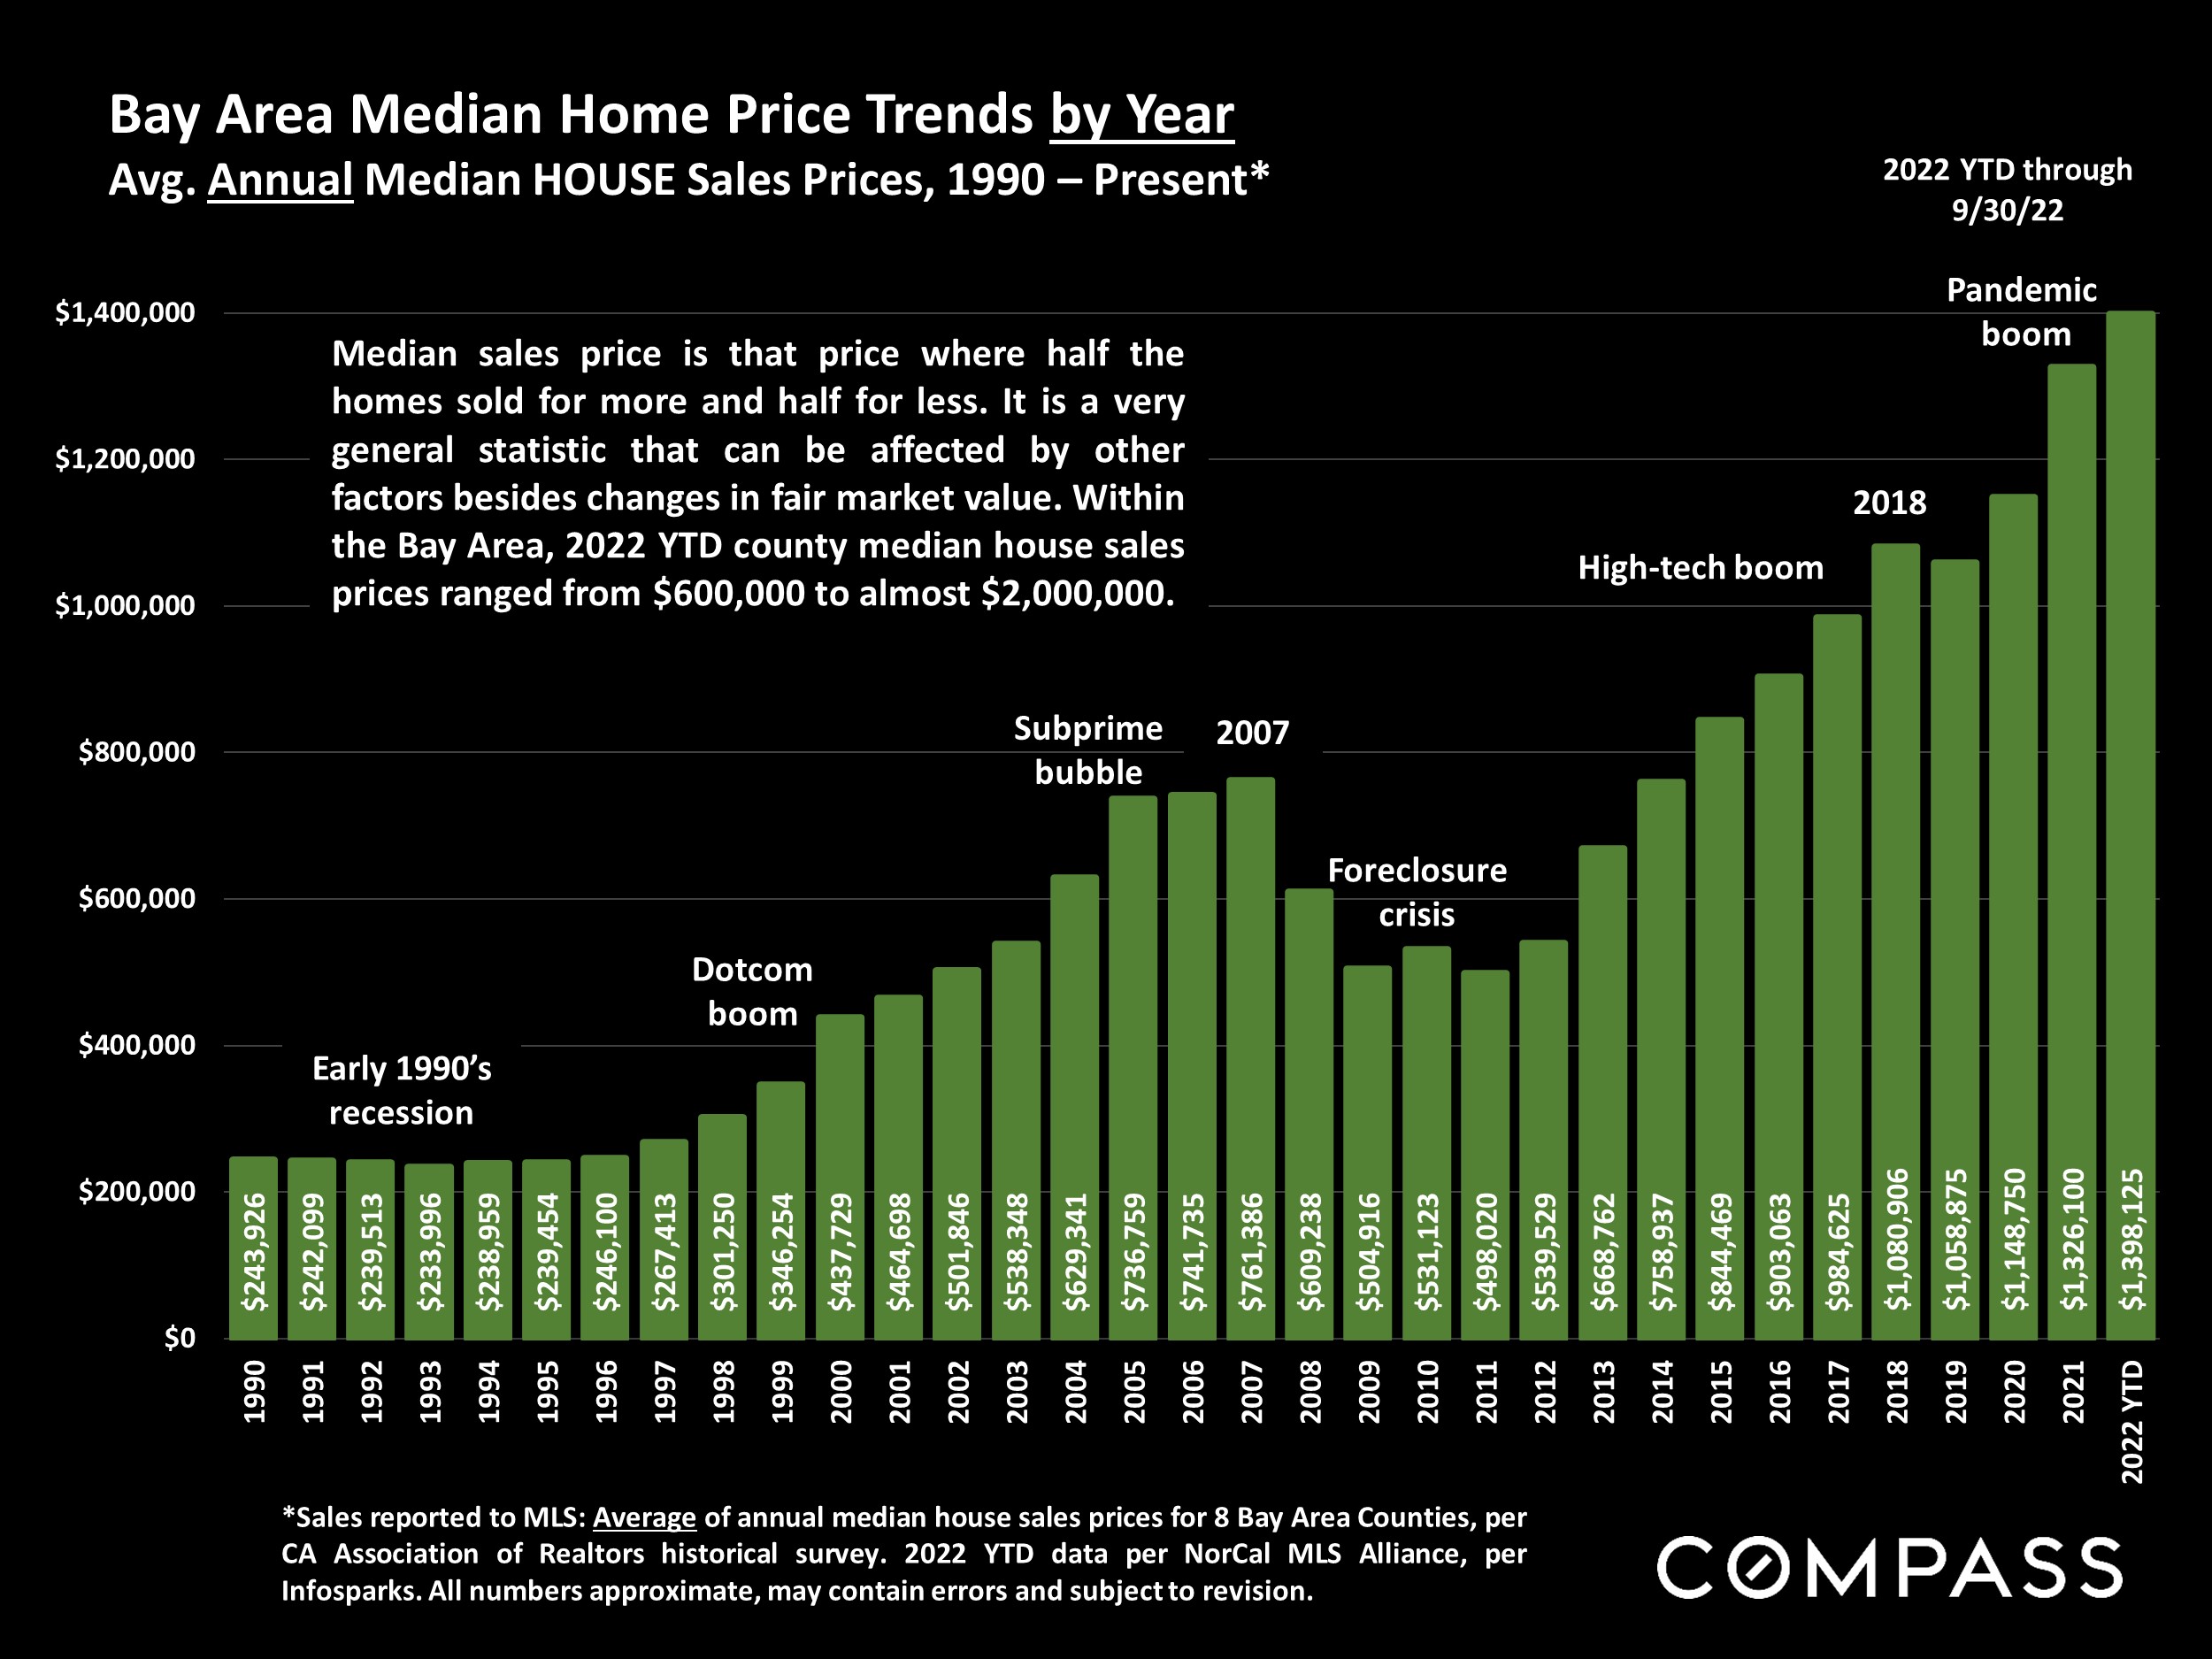
Finally here’s the median price for the entire Bay Area since 1990.
Want to See More? Click to View