It's that time of year when our days are balanced between looking back at the past year for insights and planning for next year. As a team we are so excited about 2023 - we’ve added new team members and we’re planning a number of events that will provide our clients with content that we, as your trusted real estate advisors, feel is important for any homeowner or investor. Be on the lookout for info on our Trust and Estate seminar with Matt Shafae in January.
We’re ending the year in a very different place than we started, but not uncommon for December: the number of sales look similar if you look at Decembers of the past. However, the drop in the total number of sales since May of this year cooled our market down sooner than expected. Check out our BLOG for more details on the various factors that contributed to that in our previous months updates. We’ll wrap our final update of 2022 taking a look at Median Price, review a breakdown of sales by price point and look at year over year appreciation for our market (TLDR - despite slow down both counties still have positive appreciation for 2022).
Warmly,
Adam, Wendy and Kat
Brief Summary
-
Median Price
-
Breakdown of sales by price point
- Year over Year appreciation
1. Median Price
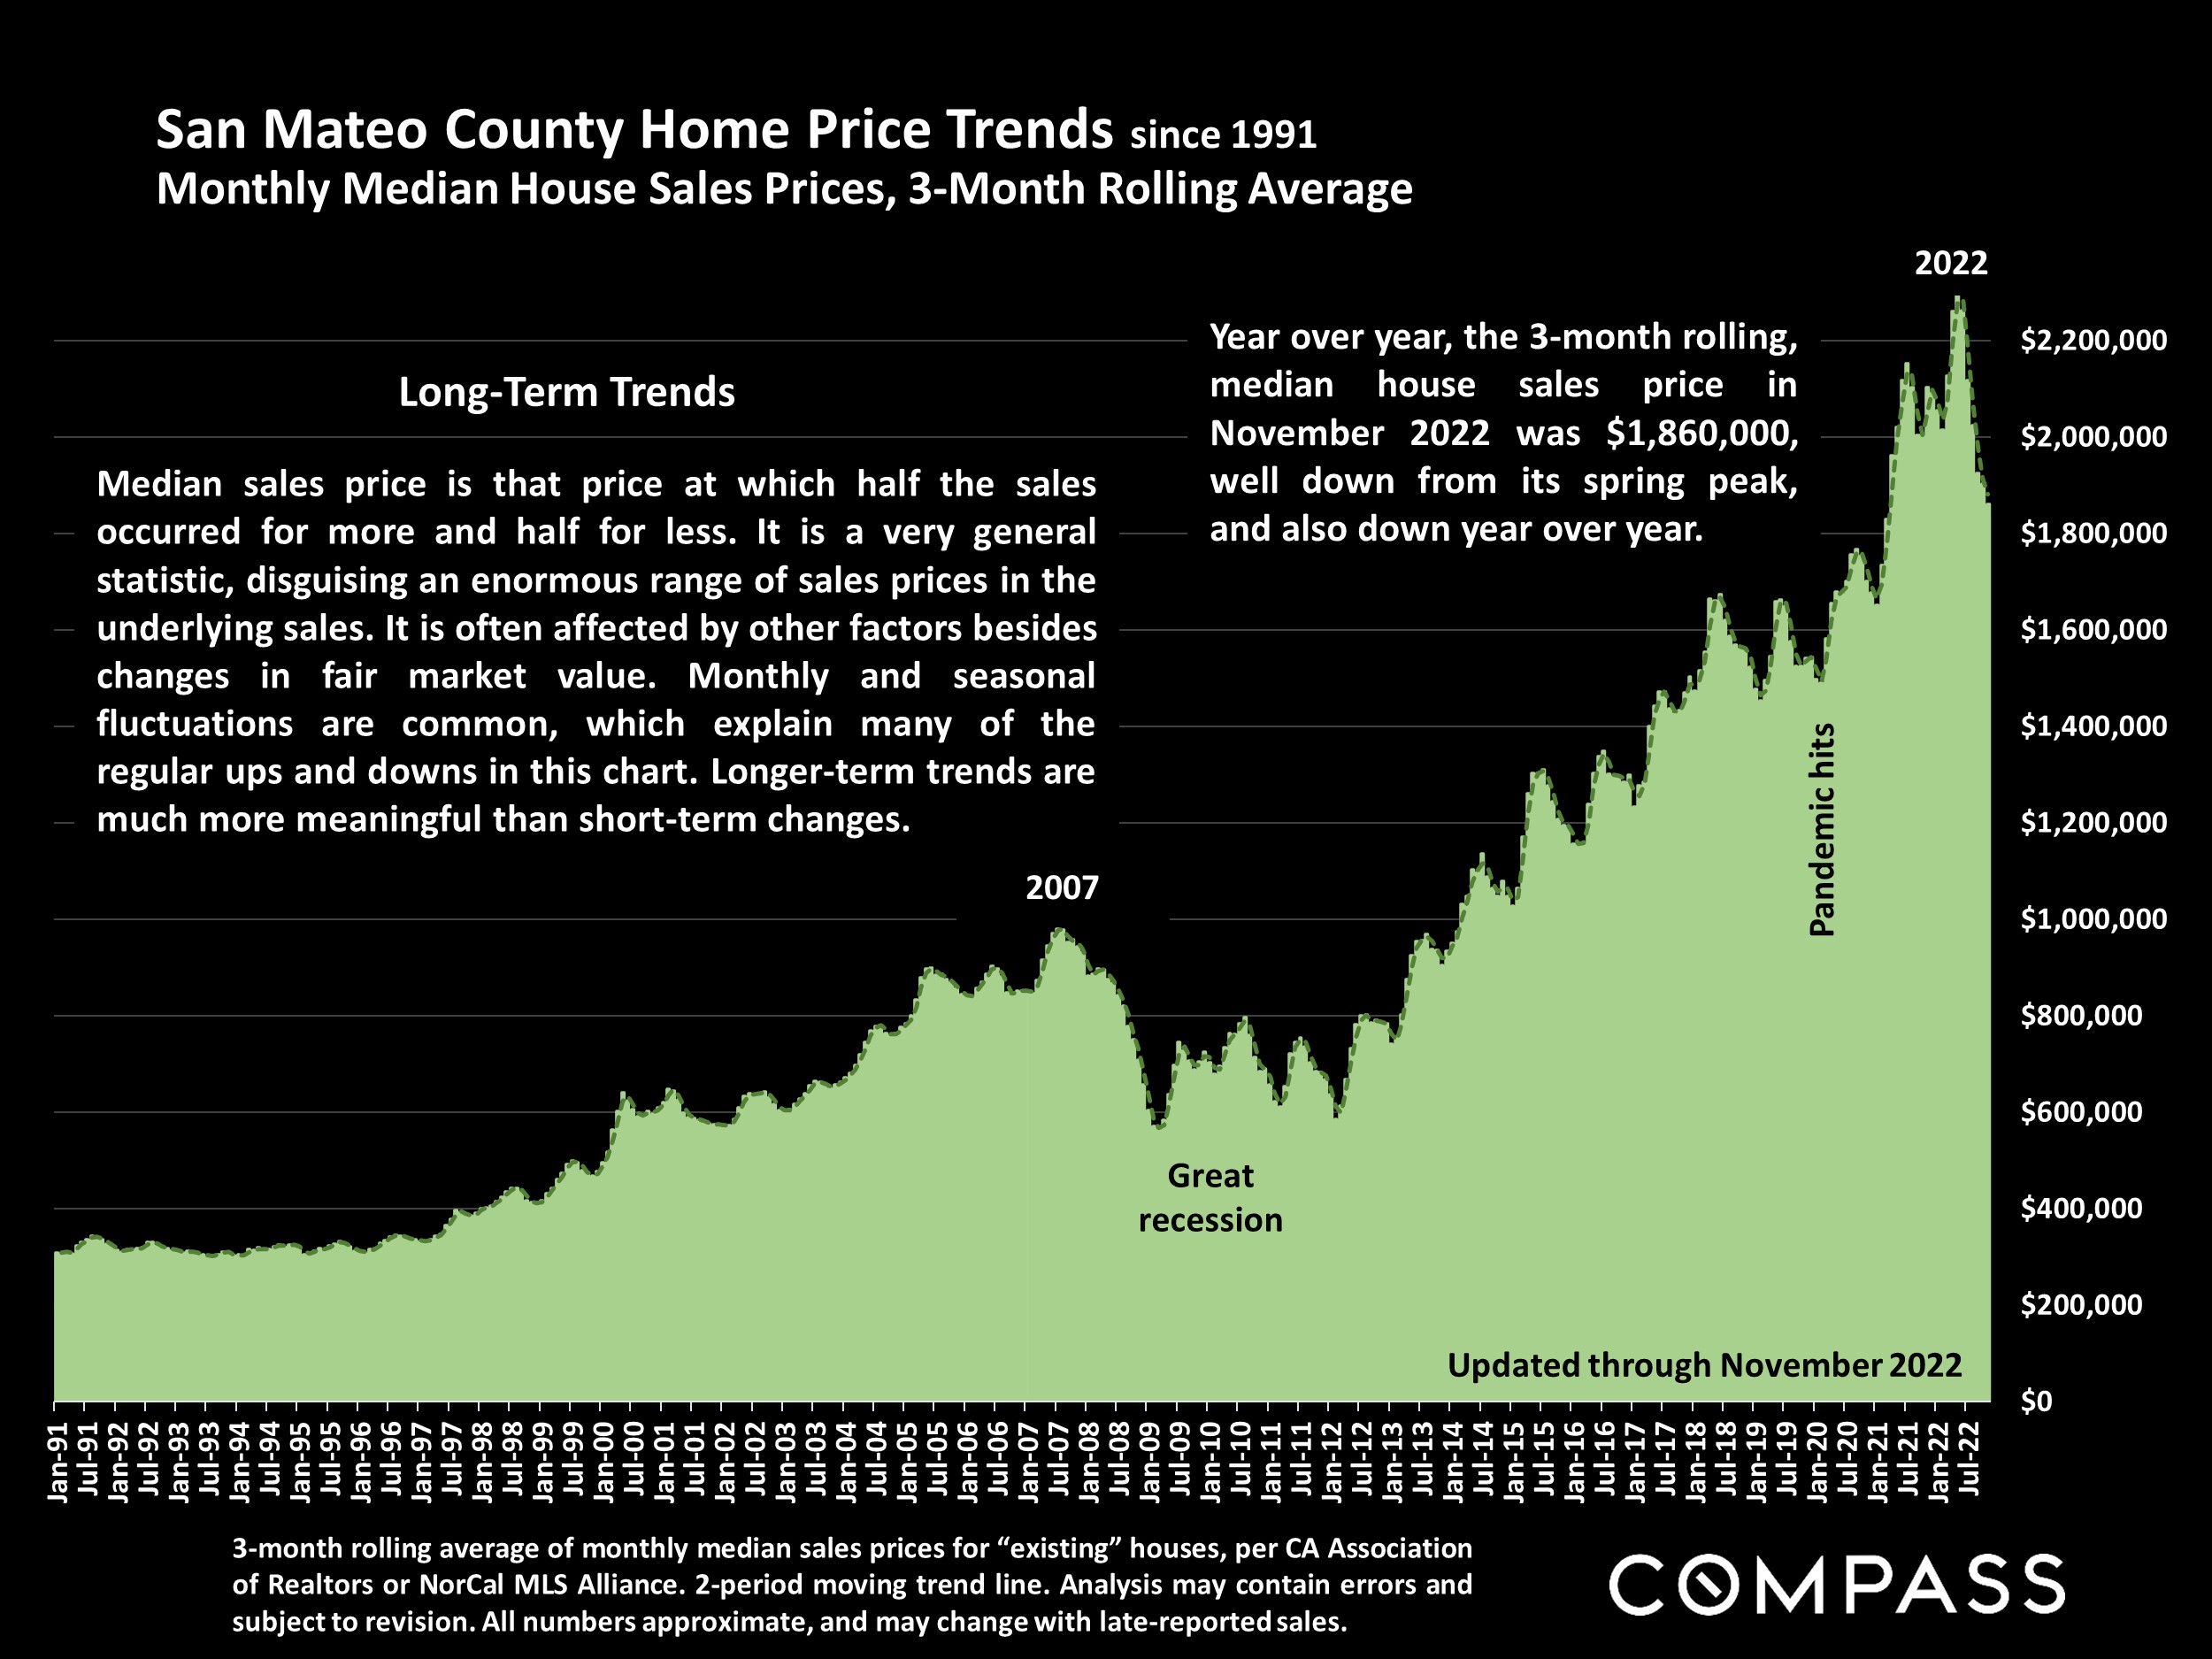
This month we’re looking at the median sales price on a rolling three month average. In San Mateo County, the median price is $1,860,000 which is down from the 2Q2022 peak just above $2,200,000. The current median price is in line with prices in Jan 2021.

The median price in Santa Clara County median price is $1,600,000 which is down from the 2Q2022 peak just above $1,900,000. The current median price is in line with July 2021.

2. Breakdown of sales by price point
These charts combine the single family homes from August through November of 2022. In San Mateo County there 1219 sales and 2729 sales in Santa Clara County. In San Mateo 58% of sales were under $2m while in Santa Clara County two out every three sales were under $2m (67%).


Over the last four months, only 18% of sales in San Mateo and 14% in Santa Clara were over $3m. There are many factors that affect median sales price, and one that drove the significant increase in median price since 2020 was the large number of higher priced home sales.


There are several reasons we believe sales at this price point have slowed down. Most buyers that purchased their homes in the last six years likely have an interest rate under 5%. In this higher interest rate environment, they’re less likely to sell and buy with new rates unless they absolutely need more space. Most owners in this price point also have a significant amount of equity in their home and are using that to remodel or expand instead of selling. FInally in the higher price points, home buying decisions can be more discretionary: sellers in this price point might be waiting to sell until market conditions improve in order to achieve their desired sales price.

3. Year over Year appreciation
One way to evaluate where you are is to look at where you’ve been. These historical appreciation charts show the month-by-month steep ride up Bay Area real estate had the past couple years.

The county breakdowns show year over year since 1990.


What will 2023 hold? We look forward to working with you as your advisors to parse the data and help inform your decision making - it is what we love about our jobs and a role we’re most grateful for!
Want to See More? Click to View


